
Page 226 - EJMO-9-1
P. 226
Eurasian Journal of Medicine and
Oncology
Psoas muscle and atherosclerotic inflammation
A B
C
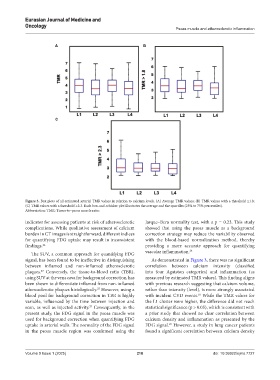
Figure 3. Box plots of all estimated arterial TMR values in relation to calcium levels. (A) Average TMR values; (B) TMR values with a threshold ≥1.8;
(C) TMR values with a threshold ≥2.3. Each box-and-whisker plot illustrates the average and the quartiles (25% to 75% percentiles).
Abbreviation: TMR: Tissue-to-psoas muscle ratio.
indicator for assessing patients at risk of atherosclerotic Jarque–Bera normality test, with a p = 0.23. This study
complications. While qualitative assessment of calcium showed that using the psoas muscle as a background
burden in CT images is straightforward, different indices correction strategy may reduce the variability observed
for quantifying FDG uptake may result in inconsistent with the blood-based normalization method, thereby
findings. 22 providing a more accurate approach for quantifying
The SUV, a common approach for quantifying FDG vascular inflammation. 28
signal, has been found to be ineffective in distinguishing As demonstrated in Figure 3, there was no significant
between inflamed and non-inflamed atherosclerotic correlation between calcium intensity (classified
plaques. Conversely, the tissue-to-blood ratio (TBR), into four Agatston categories) and inflammation (as
27
using SUV at the vena cava for background correction, has measured by estimated TMR values). This finding aligns
been shown to differentiate inflamed from non-inflamed with previous research suggesting that calcium volume,
atherosclerotic plaques histologically. However, using a rather than intensity (level), is more strongly associated
27
blood pool for background correction in TBR is highly with incident CVD events. While the TMR values for
10
variable, influenced by the time between injection and the L1 cluster were higher, the difference did not reach
scan, as well as injected activity. Consequently, in the statistical significance (p > 0.05), which is consistent with
27
present study, the FDG signal in the psoas muscle was a prior study that showed no clear correlation between
used for background correction when quantifying FDG calcium density and inflammation as presented by the
uptake in arterial walls. The normality of the FDG signal FDG signal. However, a study in lung cancer patients
29
in the psoas muscle region was confirmed using the found a significant correlation between calcium density
Volume 9 Issue 1 (2025) 218 doi: 10.36922/ejmo.7727