
Page 225 - EJMO-9-1
P. 225
Eurasian Journal of Medicine and
Oncology
Psoas muscle and atherosclerotic inflammation
A B >1.8 (Figure 3B), and TMR values with a threshold >2.3
(Figure 3C).
Figure 4 shows a box-and-whisker plot of the estimated
TMR values from PET images corresponding to the
calcium area in CT images. The calcium area was calculated
as the ratio of calcium to arterial wall circumference and
clustered into four categories (A1, A2, A3, and A4 in
C D ascending order).
No significant differences were observed in the
computed TMR values (TMR, TMR >1.8, and TMR >2.3)
corresponding to the calcium area clusters A1, A2, and
A3 (p > 0.05). However, FDG absorption in the ROIs
corresponding to larger calcium area cluster (A4) was
found to be statistically higher in terms of TMR values
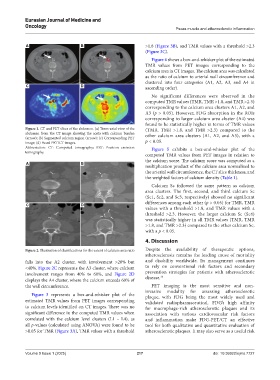
Figure 1. CT and PET slices of the abdomen. (a) Trans-axial view of the (TMR, TMR >1.8, and TMR >2.3) compared to the
abdomen from the CT image showing the aorta with calcium burden other calcium area clusters (A1, A2, and A3), with a
(arrow); (b) Segmented calcium region (arrow); (c) Corresponding PET
image; (d) Fused PET/CT images. p < 0.05.
Abbreviation: CT: Computed tomography; PET: Positron emission Figure 5 exhibits a box-and-whisker plot of the
tomography.
computed TMR values from PET images in relation to
the calcium score. The calcium score was computed as a
A B
multiplication product of the calcium area normalized to
the arterial wall circumference, the CT slice thickness, and
the weighted factors of calcium density (Table 1).
Calcium Sc followed the same pattern as calcium
area clusters. The first, second, and third calcium Sc
(Sc1, Sc2, and Sc3, respectively) showed no significant
differences among each other (p > 0.05) for TMR, TMR
C D
values with a threshold >1.8, and TMR values with a
threshold >2.3. However, the larger calcium Sc (Sc4)
was statistically higher in all TMR values (TMR, TMR
>1.8, and TMR >2.3) compared to the other calcium Sc,
with a p < 0.05.
4. Discussion
Figure 2. Illustration of classifications for the extent of calcium area ratio Despite the availability of therapeutic options,
atherosclerosis remains the leading cause of mortality
falls into the A2 cluster, with involvement >20% but and disability worldwide. Its management continues
<40%. Figure 2C represents the A3 cluster, where calcium to rely on conventional risk factors and secondary
involvement ranges from 40% to 60%, and Figure 2D prevention strategies for patients with atherosclerotic
26
displays the A4 cluster, where the calcium exceeds 60% of disease.
the wall circumference. PET imaging is the most sensitive and non-
invasive modality for assessing atherosclerotic
Figure 3 represents a box-and-whisker plot of the plaque, with FDG being the most widely used and
estimated TMR values from PET images corresponding validated radiopharmaceutical. FDG’s high affinity
to calcium levels identified on CT images. There was no for macrophage-rich atherosclerotic plaques and its
significant difference in the computed TMR values when association with various cardiovascular risk factors
correlated with the calcium level clusters (L1 – L4), as and inflammation make FDG-PET/CT an effective
all p-values (calculated using ANOVA) were found to be tool for both qualitative and quantitative evaluation of
>0.05 for TMR (Figure 3A), TMR values with a threshold atherosclerotic plaques. It may also serve as a useful risk
Volume 9 Issue 1 (2025) 217 doi: 10.36922/ejmo.7727