
Page 234 - EJMO-9-1
P. 234
Eurasian Journal of Medicine and
Oncology
Grains, legumes, and gastric cancer
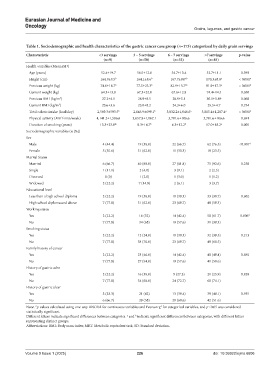
Table 1. Sociodemographic and health characteristics of the gastric cancer case group (n=173) categorized by daily grain servings
Characteristic <3 servings 3 – 5 servings 6 – 7 servings >7 servings p‑value
(n=9) (n=50) (n=33) (n=81)
Health variables (Mean±SD)
Age (years) 52.4±19.7 56.5±12.8 54.7±13.4 52.7±11.1 0.393
Height (cm) 164.9±9.5 b 164.1±8.6 b 167.7±9.0 ab 170.3±8.8 a < 0.001*
Previous weight (kg) 74.6±18.7 b 77.5±23.3 b 82.9±15.7 ab 91.9±17.3 a < 0.001*
Current weight (kg) 64.3±13.8 67.3±22.0 67.6±12.8 74.4±14.5 0.050
Previous BMI (kg/m ) 27.2±4.1 28.9±8.5 28.9±5.1 30.1±5.89 0.068
2
Current BMI (kg/m ) 23.6±3.6 25.0±8.2 24.3±6.0 25.5±4.7 0.754
2
Total caloric intake (kcal/day) 2,569.3±593.5 b 2,646.9±699.1 b 3,832.2±1,046.6 a 3,815.4±1,287.4 a < 0.001*
Physical activity (MET-min/week) 4,141.2±1,586.6 3,657.8±1,067.1 3,701.6±106.6 3,701.6±106.6 0.691
Duration of smoking (years) 13.3±23.0 ab 8.3±14.7 b 6.3±12.2 b 17.0±18.2 a 0.005
Sociodemographic variables (n [%])
Sex
Male 4 (44.4) 19 (38.0) 22 (66.7) 62 (76.5) <0.001*
Female 5 (55.6) 31 (62.0) 11 (33.3) 19 (23.5)
Marital Status
Married 6 (66.7) 40 (80.0) 27 (81.8) 75 (92.6) 0.258
Single 1 (11.1) 2 (4.0) 3 (9.1) 2 (2.5)
Divorced 0 (0) 1 (2.0) 1 (3.0) 1 (1.2)
Widowed 2 (22.2) 7 (14.0) 2 (6.1) 3 (3.7)
Educational level
Less than a high school diploma 2 (22.2) 19 (38.0) 10 (30.3) 33 (30.7) 0.602
High school diploma and above 7 (77.8) 31 (62.0) 23 (69.7) 48 (59.3)
Working status
Yes 2 (22.2) 16 (32) 14 (42.4) 50 (61.7) 0.006*
No 7 (77.8) 34 (68) 19 (57.6) 31 (38.3)
Smoking status
Yes 2 (22.2) 12 (24.0) 10 (30.3) 32 (39.5) 0.213
No 7 (77.8) 38 (76.0) 23 (69.7) 49 (60.5)
Family history of cancer
Yes 2 (22.2) 23 (46.0) 14 (42.4) 40 (49.4) 0.692
No 7 (77.8) 27 (54.0) 19 (57.6) 41 (50.6)
History of gastric ache
Yes 2 (22.2) 16 (38.0) 9 (27.3) 21 (25.9) 0.829
No 7 (77.8) 34 (68.0) 24 (72.7) 60 (74.1)
History of gastric ulcer
Yes 3 (33.3) 21 (42) 13 (39.4) 39 (48.1) 0.935
No 6 (66.7) 29 (58) 20 (60.6) 42 (51.6)
Note: *p‑values calculated using one-way ANOVA for continuous variables and Pearson χ for categorical variables, and p≤0.05 was considered
2
statistically significant.
Different letters indicate significant differences between categories. and indicate significant differences between categories, with different letters
a
b
representing distinct groups.
Abbreviations: BMI: Body mass index; MET: Metabolic equivalent task; SD: Standard deviation.
Volume 9 Issue 1 (2025) 226 doi: 10.36922/ejmo.6606