
Page 236 - EJMO-9-1
P. 236
Eurasian Journal of Medicine and
Oncology
Grains, legumes, and gastric cancer
day had significantly higher total caloric intake (3,387.1 ± among participants and the risk of GC, using adjusted
1,266.1 kcal/day) compared to those consuming less than ORs categorized into quartiles based on intake levels.
three servings (1968.0 ± 806.5 kcal/day) and 3 – 5 servings A significant trend was observed for white bread
per day (2209.8 ± 694.9 kcal/day; p = 0.006). In addition, consumption, with the highest quartile showing an
physical activity levels (MET-min/week) were significantly increased risk of GC (OR = 3.13, CI: 1.57 – 6.21, p = 0.001).
higher among participants consuming more than seven Conversely, moderate white rice consumption was linked
servings per day (4895.6 ± 2296.5 MET-min/week) and 6 to a reduced risk of GC in the second quartile (OR = 0.38,
– 7 servings per day (4,608.3 ± 2,116.8 MET-min/week) CI: 0.18 – 0.81), with a significant p = 0.045; however,
compared to those consuming less than three or 3 – 5 higher consumption in the third and fourth quartiles was
servings per day (4140.8 ± 1694.6 MET-min/week, 3959.5 associated with increased but non-significant risk.
± 1,545.4 MET-min/week, respectively; p = 0.003). Similar Regarding legumes, green peas showed an increased
to Table 1, sex distribution (p < 0.001) and employment risk in the third quartile (OR = 2.19, CI: 1.24 – 3.88,
status (P = 0.004) varied significantly among the groups.
p = 0.004). In addition, cooked dried beans (fava beans,
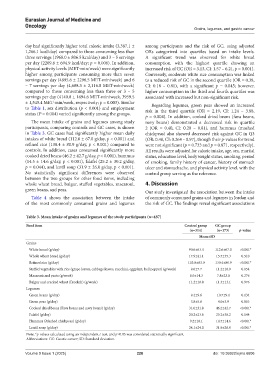
The mean intake of grains and legumes among study navy beans) demonstrated a decreased risk in quartile
participants, comparing controls and GC cases, is shown 2 (OR = 0.40, CI: 0.20 – 0.81), and hummus (mashed
in Table 3. GC cases had significantly higher mean daily chickpeas) also showed decreased risk against GC in Q3
intakes of white bread (112.6 ± 67.0 g/day, p < 0.001) and (OR: 0.48, CI: 0.264 – 0.97), though their p-values for trend
refined rice (130.4 ± 80.9 g/day, p < 0.001) compared to were not significant (p = 0.733 and p = 0.871, respectively).
controls. In addition, cases consumed significantly more All results were adjusted for caloric intake, age, sex, marital
cooked dried beans (46.2 ± 42.7 g/day, p < 0.001), hummus status, education level, body weight status, smoking, period
(14.5 ± 14.6 g/day, p < 0.001), falafel (25.2 ± 30.2 g/day, of smoking, family history of cancer, history of stomach
p = 0.044), and lentil soup (31.9 ± 26.0 g/day, p < 0.001). ulcer and stomachache, and physical activity level, with the
No statistically significant differences were observed control group serving as the reference.
between the two groups for other food items, including
whole wheat bread, bulgur, stuffed vegetables, macaroni, 4. Discussion
green beans, and peas. Our study investigated the association between the intake
Table 4 shows the association between the intake of commonly consumed grains and legumes in Jordan and
of the most commonly consumed grains and legumes the risk of GC. The findings reveal significant associations
Table 3. Mean intake of grains and legumes of the study participants (n=487)
Food item Control group GC group
(n=314) (n=173) p‑value
Mean±SD
Grains
White bread (g/day) 90.6±63.4 112.6±67.0 <0.001*
Whole wheat bread (g/day) 17.9±41.1 15.5±35.3 0.510
Refined rice (g/day) 103.0±63.0 130.4±80.9 <0.001*
Stuffed vegetables with rice (grape leaves, cabbage leaves, zucchini, eggplant, bell pepper) (g/week) 9.6±7.7 11.2±10.9 0.054
Macaroni and pasta (g/week) 6.0±14.3 7.8±23.0 0.276
Bulgur and cracked wheat (Freekeh) (g/week) 11.2±18.8 11.3±13.1 0.976
Legumes
Green beans (g/day) 9.4±9.6 10.7±9.1 0.134
Green peas (g/day) 3.8±5.6 4.0±3.9 0.803
Cooked dried beans (Fava beans and navy beans) (g/day) 31.0±31.8 46.2±42.7 <0.001*
Falafel (g/day) 20.2±23.6 25.2±30.2 0.044
Hummus (Mashed chickpeas) (g/day) 9.2±10.1 14.5±14.6 <0.001*
Lentil soup (g/day) 24.1±24.0 31.9±26.0 <0.001*
Note: *p-values calculated using an independent t-test, and p≤0.05 was considered statistically significant.
Abbreviations: GC: Gastric cancer; SD: Standard deviation.
Volume 9 Issue 1 (2025) 228 doi: 10.36922/ejmo.6606