
Page 237 - EJMO-9-1
P. 237
Eurasian Journal of Medicine and
Oncology
Grains, legumes, and gastric cancer
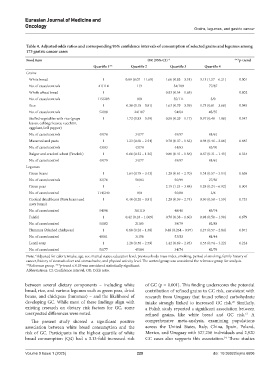
Table 4. Adjusted odds ratios and corresponding 95% confidence intervals of consumption of selected grains and legumes among
173 gastric cancer cases
Food item OR (95% CI) * ***p‑trend
Quartile 1** Quartile 2 Quartile 3 Quartile 4
Grains
White bread 1 0.89 (0.07 – 11.69) 1.66 (0.83 – 3.31) 3.13 (1.57 – 6.21) 0.001
No. of cases/controls 41/114 1/3 54/109 77/87
Whole wheat bread 1 - 0.93 (0.54 – 1.63) - 0.802
No. of cases/controls 115/203 0/0 55/111 3/0
Rice 1 0.38 (0.18 – 0.81) 1.63 (0.79 – 3.39) 1.73 (0.81 – 3.68) 0.045
No. of cases/controls 52/88 24/107 54/64 43/55
Stuffed vegetables with rice (grape 1 1.72 (0.83 – 3.59) 0.58 (0.29 – 1.17) 0.97 (0.48 – 1.98) 0.347
leaves, cabbage leaves, zucchini,
eggplant, bell pepper)
No. of cases/controls 49/78 34/77 49/97 41/61
Macaroni and pasta 1 1.23 (0.60 – 2.54) 0.78 (0.37 – 1.63) 0.98 (0.46 – 2.06) 0.487
No. of cases/controls 43/83 43/78 44/83 43/70
Bulgur and cracked wheat (Freekeh) 1 0.66 (0.32 – 1.36) 0.80 (0.41 – 1.56) 0.67 (0.31 – 1.45) 0.334
No. of cases/control 49/79 34/77 49/97 41/61
Legumes
Green beans 1 1.64 (0.78 – 3.43) 1.28 (0.61 – 2.70) 1.34 (0.57 – 3.14) 0.638
No. of cases/controls 32/76 58/83 56/99 27/56
Green peas 1 - 2.19 (1.24 – 3.88) 1.28 (0.24 – 6.92) 0.004
No. of cases/control 114/240 0/0 56/68 3/6
Cooked dried beans (Fava beans and 1 0.40 (0.20 – 0.81) 1.28 (0.59 – 2.74) 0.96 (0.58 – 1.59) 0.733
navy beans)
No. of cases/control 54/90 36/110 40/40 45/74
Falafel 1 0.42 (0.18 – 1.009) 0.78 (0.38 – 1.60) 0.98 (0.50 – 1.90) 0.679
No. of cases/control 51/82 21/65 39/79 62/88
Hummus (Mashed chickpeas) 1 0.60 (0.26 – 1.38) 0.48 (0.264 – 0.97) 1.27 (0.57 – 2.84) 0.871
No. of cases/control 48/61 31/56 53/53 41/44
Lentil soup 1 1.20 (0.56 – 2.59) 1.42 (0.69 – 2.93) 1.55 (0.74 – 3.22) 0.224
No. of cases/control 51/77 45/84 34/74 42/79
Note: *Adjusted for caloric intake, age, sex, marital status, education level, previous body mass index, smoking, period of smoking, family history of
cancer, history of stomach ulcer and stomachache, and physical activity level. The control group was considered the reference group for analysis.
**Reference group. ***p-trend ≤ 0.05 was considered statistically significant.
Abbreviations: CI: Confidence interval; OR: Odds ratio.
between several dietary components – including white of GC (p = 0.001). This finding underscores the potential
bread, rice, and various legumes such as green peas, dried contribution of refined grains to GC risk, consistent with
beans, and chickpeas (hummus) – and the likelihood of research from Uruguay that found refined carbohydrate
developing GC. While most of these findings align with intake strongly linked to increased GC risk. Similarly,
23
existing research on dietary risk factors for GC, some a Polish study reported a significant association between
unexpected differences were noted. refined grains, like white bread and GC risk. A
13
The present study showed a significant positive comprehensive meta-analysis, examining populations
association between white bread consumption and the across the United States, Italy, China, Spain, Poland,
risk of GC. Participants in the highest quartile of white Mexico, and Uruguay with 527,256 individuals and 2,920
bread consumption (Q4) had a 3.13-fold increased risk GC cases also supports this association. These studies
14
Volume 9 Issue 1 (2025) 229 doi: 10.36922/ejmo.6606