
Page 235 - EJMO-9-1
P. 235
Eurasian Journal of Medicine and
Oncology
Grains, legumes, and gastric cancer
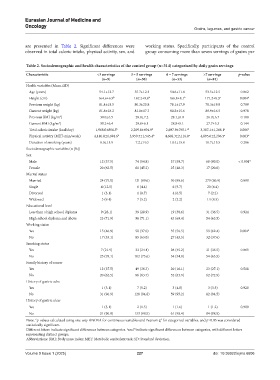
are presented in Table 2. Significant differences were working status. Specifically, participants of the control
observed in total caloric intake, physical activity, sex, and group consuming more than seven servings of grains per
Table 2. Sociodemographic and health characteristics of the control group (n=314) categorized by daily grain servings
Characteristic <3 servings 3 – 5 servings 6 – 7 servings >7 servings p‑value
(n=9) (n=50) (n=33) (n=81)
Health variables (Mean±SD)
Age (years) 54.1±13.7 55.7±12.3 50.6±11.8 53.5±12.5 0.062
Height (cm) 164.6±6.9 b 167.2±9.0 b 166.8±8.1 b 171.2±8.3 a 0.004*
Previous weight (kg) 81.4±18.5 80.3±20.8 78.1±17.9 78.3±19.8 0.799
Current weight (kg) 81.8±18.2 81.0±17.3 80.2±15.6 80.9±16.5 0.978
2
Previous BMI (kg/m ) 30.0±6.5 28.8±7.2 28.1±6.0 26.9±6.7 0.100
Current BMI (kg/m ) 30.2±6.4 29.0±6.1 28.8±5.1 27.7±5.3 0.144
2
Total caloric intake (kcal/day) 1,968.0±806.5 b 2,209.8±694.9 b 2,697.9±765.1 ab 3,387.1±1,266.1 a 0.006*
Physical activity (MET-min/week) 4,140.8±1,694.6 b 3,959.5±1,545.4 b 4,608.3±2,116.8 a 4,895.6±2,296.5 a 0.003*
Duration of smoking (years) 8.0±15.9 7.2±14.0 10.4±15.0 10.7±15.5 0.286
Sociodemographic variables (n [%])
Sex
Male 12 (37.5) 74 (54.8) 37 (59.7) 68 (80.0) < 0.001*
Female 20 (62.5) 61 (45.2) 25 (40.3) 17 (20.0)
Marital status
Married 24 (75.0) 121 (89.6) 50 (80.6) 273 (86.9) 0.090
Single 4 (12.5) 6 (4.4) 6 (9.7) 20 (6.4)
Divorced 1 (3.1) 1 (0.7) 4 (6.5) 7 (2.2)
Widowed 3 (9.4) 7 (5.2) 2 (3.2) 14 (4.5)
Educational level
Less than a high school diploma 9 (28.1) 39 (28.9) 19 (30.6) 31 (36.5) 0.924
High school diploma and above 23 (71.9) 96 (71.1) 43 (69.4) 54 (63.5)
Working status
Yes 15 (46.9) 50 (37.0) 35 (56.5) 53 (62.4) 0.004*
No 17 (53.1) 85 (63.0) 27 (43.5) 32 (37.6)
Smoking status
Yes 7 (21.9) 33 (24.4) 28 (45.2) 31 (36.5) 0.065
No 25 (78.1) 102 (75.6) 34 (54.8) 54 (63.5)
Family history of cancer
Yes 12 (37.5) 49 (36.3) 20 (16.1) 23 (27.1) 0.518
No 20 (62.5) 86 (63.7) 52 (83.9) 62 (72.9)
History of gastric ache
Yes 1 (3.1) 7 (5.2) 3 (4.8) 3 (3.5) 0.920
No 31 (96.9) 128 (94.8) 59 (95.2) 82 (94.5)
History of gastric ulcer
Yes 1 (3.1) 2 (1.5) 1 (1.6) 1 (1.2) 0.900
No 31 (96.9) 133 (98.5) 61 (98.4) 84 (98.8)
Note: *p-values calculated using one-way ANOVA for continuous variables and Pearson χ for categorical variables, and p≤0.05 was considered
2
statistically significant.
Different letters indicate significant differences between categories. and indicate significant differences between categories, with different letters
b
a
representing distinct groups.
Abbreviations: BMI: Body mass index; MET: Metabolic equivalent task; SD: Standard deviation.
Volume 9 Issue 1 (2025) 227 doi: 10.36922/ejmo.6606