
Page 141 - EJMO-9-2
P. 141
Eurasian Journal of
Medicine and Oncology Ovarian cyst differentiation score
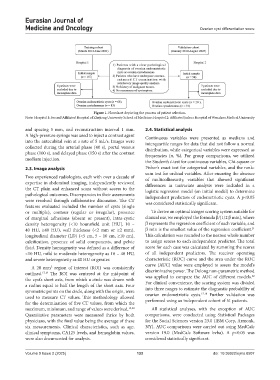
Figure 1. Flowchart depicting the process of patient selection.
Note: Hospital 1: Second Affiliated Hospital of Zhejiang University School of Medicine; Hospital 2: Affiliated Jinhua Hospital of Wenzhou Medical University
and spacing 5 mm, and reconstruction interval 1 mm. 2.4. Statistical analysis
A high-pressure syringe was used to inject a contrast agent Continuous variables were presented as medians and
into the antecubital vein at a rate of 5 mL/s. Images were interquartile ranges for data that did not follow a normal
collected during the arterial phase (40 s), portal venous distribution, while categorical variables were expressed as
phase (100 s), and delayed phase (150 s) after the contrast frequencies (n, %). For group comparisons, we utilized
medium injection.
the Student’s t-test for continuous variables, Chi-square or
2.3. Image analysis Fisher’s exact test for categorical variables, and the rank-
sum test for ordinal variables. After ensuring the absence
Two experienced radiologists, each with over a decade of of multicollinearity, variables that showed significant
expertise in abdominal imaging, independently reviewed differences in univariate analysis were included in a
the CT plain and enhanced scans without access to the logistic regression model (an initial model) to determine
pathological outcomes. Discrepancies in their assessments independent predictors of endometriotic cysts. A p<0.05
were resolved through collaborative discussion. The CT was considered statistically significant.
features evaluated included the number of cysts (single
or multiple), contour (regular or irregular), presence To derive an optimal integer scoring system suitable for
of marginal adhesions (absent or present), intra-cystic clinical use, we employed the formula β/(1/2 β min), where
density heterogeneity (<10 hounsfield unit [HU], 10 – β represents the regression coefficient of each variable, and
21
40 HU, ≥40 HU), wall thickness (<2 mm or ≥2 mm), β min is the smallest value of the regression coefficient.
longitudinal diameter (LD) (<5 cm, 5 – 10 cm, ≥10 cm), This calculation was rounded to the nearest whole number
calcification, presence of solid components, and pelvic to assign scores to each independent predictor. The total
fluid. Density homogeneity was defined as a difference of score for each case was calculated by summing the scores
<10 HU, mild to moderate heterogeneity as 10 – 40 HU, of all independent predictors. The receiver operating
and severe heterogeneity as 40 HU or greater. characteristic (ROC) curve and the area under the ROC
curve (AUC) value were employed to assess the model’s
A 20 mm² region of interest (ROI) was consistently
outlined. 17,18 The ROI was centered at the midpoint of discriminative power. The Delong non-parametric method
22
the cyst’s short axis, from which a circle was drawn with was applied to compare the AUC of different models.
a radius equal to half the length of the short axis. Four For clinical convenience, the scoring system was divided
symmetric points on the circle, along with the origin, were into three ranges to estimate the diagnostic probability of
17,18
used to measure CT values. This methodology allowed ovarian endometriotic cysts. Further validation was
for the determination of five CT values, from which the performed using an independent cohort of 51 patients.
maximum, minimum, and range of values were derived. 19,20 All statistical analyses, with the exception of AUC
Quantitative parameters were measured thrice by both comparisons, were conducted using Statistical Packages
physicians, with the final value being the average of these for the Social Sciences version 23.0 (IBM Corp, Armonk,
six measurements. Clinical characteristics, such as age, NY). AUC comparisons were carried out using MedCalc
clinical symptoms, CA125 levels, and hemoglobin values, version 19.0 (MedCalc Software bvba). A p<0.05 was
were also documented for analysis. considered statistically significant.
Volume 9 Issue 2 (2025) 133 doi: 10.36922/ejmo.8507