
Page 144 - EJMO-9-2
P. 144
Eurasian Journal of
Medicine and Oncology Ovarian cyst differentiation score
Table 2. Multivariate regression analysis for ovarian endometriotic cysts diagnosis and the weighted score of independent
predictors
Variables Weighted score B Standard error p OR 95% CI for OR
Elevated CA125 4 6.472 2.170 0.003 28.47 5.11 – 158.55
20 < Age ≤ 50 4 7.339 3.282 0.025 0.17 0.04 – 0.72
Wall thickness ≥2 mm 3 5.365 2.027 0.008 7.45 1.59 – 34.82
Marginal adhesions 2 3.725 1.640 0.023 6.97 1.16 – 41.7
Mild to moderate density heterogeneity 2 3.298 1.524 0.030 0.23 0.06 – 0.86
CI: Confidence interval; OR: Odds ratio.
Table 3. Diagnostic probability of ovarian endometriotic cysts classified in different score ranges
Score range Number of patients with ovarian Total number Diagnostic probability of ovarian
endometriotic cysts endometriotic cysts
Training cohort Validation cohort Training cohort Validation cohort Training cohort (%) Validation cohort (%)
0 – 6 points 0 0 70 28 0 0
7 – 8 points 7 1 18 3 38.89 33.33
>8 – ≤15 points 61 19 63 20 96.83 95.00
A B
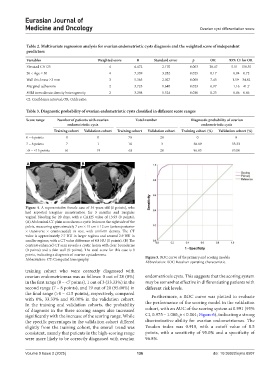
Figure 4. A representative female case of 54 years old (0 points), who
had reported irregular menstruation for 3 months and irregular
vaginal bleeding for 20 days, with a CA125 value of 13.93 (0 points).
(A) Abdominal CT plain scan shows a cystic lesion on the right side of the
pelvis, measuring approximately 7 cm × 15 cm × 12 cm (anteroposterior
× transverse × craniocaudal) in size, with uniform density. The CT
value is approximately 7.7 HU in larger regions and around 2.9 HU in
smaller regions, with a CT value difference of 4.8 HU (0 points). (B) The
contrast-enhanced CT scan reveals a cystic lesion with clear boundaries
(0 points) and a thin wall (0 points). The total score for this case is 0
points, indicating a diagnosis of ovarian cystadenoma. Figure 5. ROC curve of the primary and scoring models
Abbreviation: CT: Computed tomography.
Abbreviation: ROC: Receiver operating characteristic.
training cohort who were correctly diagnosed with
ovarian endometriomas was as follows: 0 out of 28 (0%) endometriosis cysts. This suggests that the scoring system
in the first range (0 – <7 points), 1 out of 3 (33.33%) in the may be somewhat effective in differentiating patients with
second range (7 – 8 points), and 19 out of 20 (95.00%) in different risk levels.
the final range (>8 – ≤15 points), respectively, compared Furthermore, a ROC curve was plotted to evaluate
with 0%, 33.33% and 95.00% in the validation cohort.
In the training and validation cohorts, the probability the performance of the scoring model in the validation
of diagnosis in the three scoring ranges also increased cohort, with an AUC of the scoring system at 0.991 (95%
significantly with the increase of the scoring range. While CI, 0.975 – 1.000, p < 0.001; Figure 6), indicating a strong
the specific percentages in the validation cohort differed discriminative ability for ovarian endometriomas. The
slightly from the training cohort, the overall trend was Youden index was 0.918, with a cutoff value of 8.5
consistent, namely that patients in the high-scoring range points, with a sensitivity of 95.0% and a specificity of
were more likely to be correctly diagnosed with ovarian 96.8%.
Volume 9 Issue 2 (2025) 136 doi: 10.36922/ejmo.8507