
Page 142 - EJMO-9-2
P. 142
Eurasian Journal of
Medicine and Oncology Ovarian cyst differentiation score
3. Results A B
3.1. Clinical characteristics and CT values
In the training cohort, a total of 151 patients were enrolled,
with 68 diagnosed with ovarian endometriotic cysts and
83 with ovarian cystadenomas. For group comparisons,
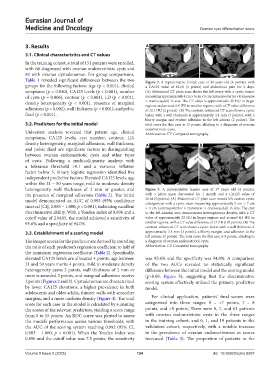
Table 1 revealed significant differences between the two Figure 2. A representative female case of 44 years old (4 points), with
groups for the following factors: Age (p < 0.001), clinical a CA125 value of 82.60 (4 points) and abdominal pain for 2 days.
symptoms (p = 0.010), CA125 levels (p < 0.001), number (A) Abdominal CT plain scan shows the left ovary with a cystic tumor
of cysts (p = 0.006), contour (p < 0.001), LD (p < 0.001), measuring approximately 4 cm × 5 cm × 5 cm (anteroposterior × transverse
density heterogeneity (p < 0.001), presence of marginal × craniocaudal) in size. The CT value is approximately 39 HU in larger
regions and around 6.9 HU in smaller regions, with a CT value difference
adhesions (p < 0.001), wall thickness (p < 0.001), and pelvic of 32.1 HU (2 points). (B) The contrast-enhanced CT scan shows a cystic
fluid (p < 0.001). lesion with a wall thickness is approximately 4.1 mm (3 points), with a
blurry margin and evident adhesion to the left adnexa (2 points). The
3.2. Predictors for the initial model total score for this case is 15 points, alluding to a diagnosis of ovarian
endometriotic cysts.
Univariate analysis revealed that patient age, clinical Abbreviation: CT: Computed tomography
symptoms, CA125 levels, cyst number, contour, LD,
density heterogeneity, marginal adhesions, wall thickness, A B
and pelvic fluid are significant factors in distinguishing
between ovarian endometriotic cysts and other types
of cysts. Following a multicollinearity analysis with
a tolerance threshold >0.1 and a variance inflation
factor below 5, binary logistic regression identified five
independent predictive factors: Elevated CA125 levels, age
within the 21 – 50 years range, mild to moderate density
heterogeneity, wall thickness of 2 mm or greater, and Figure 3. A representative female case of 37 years old (4 points),
the presence of marginal adhesions (Table 2). The initial with a pelvic mass discovered for 1 month and a CA125 value of
model demonstrated an AUC of 0.993 (95% confidence 26.64 (0 points). (A) Abdominal CT plain scan reveals left ovarian cystic
enlargement with a cystic mass measuring approximately 5 cm × 7 cm
interval [CI], 0.985 – 1.000; p < 0.001), indicating excellent × 4 cm (anteroposterior × transverse × craniocaudal) in size. The cyst
discriminative ability. With a Youden index of 0.896 and a in the left adnexal area demonstrates heterogeneous density, with a CT
cutoff value of 2.0485, the model achieved a sensitivity of value of approximately 22 HU in larger regions and around 4.3 HU in
95.6% and a specificity of 94.0%. smaller regions, with a CT value difference of 17.7 HU (0 points). (B) The
contrast-enhanced CT scan shows a cystic lesion with a wall thickness of
3.3. Establishment of a scoring model approximately 3.1 mm (3 points), a blurry margin, and adhesion to the
left adnexa (2 points). The total score for this case is 9 points, alluding to
The integer scores for the predictor are derived by rounding a diagnosis of ovarian endometriotic cysts.
the ratio of each predictor’s regression coefficient to half of Abbreviation: CT: Computed tomography
the minimum regression coefficient (Table 2). Specifically,
elevated CA125 levels are allocated 4 points, age between was 95.6% and the specificity was 94.0%. A comparison
21 and 50 years merits 4 points, mild to moderate density of the two AUCs revealed no statistically significant
heterogeneity earns 2 points, wall thickness of 2 mm or difference between the initial model and the scoring model
more is awarded 3 points, and marginal adhesions receive (p>0.05, Figure 5), suggesting that the discriminative
2 points (Figures 2 and 3). Cystadenomas are characterized scoring system effectively utilized the primary predictive
by lower CA125 elevations, a higher prevalence in both model.
adolescents and older adults, thinner walls with smoother
margins, and a more uniform density (Figure 4). The total For clinical application, patients’ final scores were
score for each case in the model is calculated by summing categorized into three ranges: 0 – <7 points, 7 – 8
the scores of the relevant predictors, yielding a score range points, and >8 points, There were 0, 7, and 61 patients
from 0 to 15 points. An ROC curve was plotted to assess with ovarian endometriotic cysts in the three ranges
the model’s performance across various thresholds, with in the training cohort, and 0, 1, and 19 patients in the
the AUC of the scoring system reaching 0.992 (95% CI, validation cohort, respectively, with a notable increase
0.983 – 1.000; p < 0.001). When the Youden index was in the prevalence of ovarian endometriomas as scores
0.896 and the cutoff value was 7.5 points, the sensitivity increased (Table 3). The proportion of patients in the
Volume 9 Issue 2 (2025) 134 doi: 10.36922/ejmo.8507