
Page 236 - EJMO-9-2
P. 236
Eurasian Journal of
Medicine and Oncology Quercetin effects in rats with liver injury
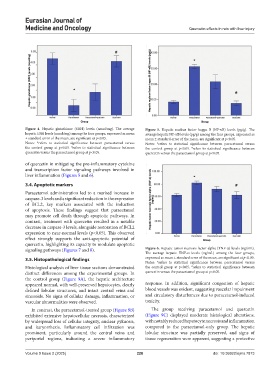
Figure 4. Hepatic glutathione (GSH) levels (nmol/mg). The average Figure 5. Hepatic nuclear factor kappa B (NF-κB) levels (pg/g). The
hepatic GSH levels (nmol/mg) among the four groups, expressed as mean average hepatic NF-κB levels (pg/g) among the four groups, expressed as
± standard error of the mean, are significant at p<0.05. mean ± standard error of the mean, are significant at p<0.05.
Notes: *refers to statistical significance between paracetamol versus Notes: *refers to statistical significance between paracetamol versus
the control group at p<0.05. refers to statistical significance between the control group at p<0.05. refers to statistical significance between
#
#
quercetin versus the paracetamol group at p<0.05. quercetin versus the paracetamol group at p<0.05.
of quercetin in mitigating the pro-inflammatory cytokine
and transcription factor signaling pathways involved in
liver inflammation (Figures 5 and 6).
3.4. Apoptotic markers
Paracetamol administration led to a marked increase in
caspase-3 levels and a significant reduction in the expression
of BCL2, key markers associated with the induction
of apoptosis. These findings suggest that paracetamol
may promote cell death through apoptotic pathways. In
contrast, treatment with quercetin resulted in a notable
decrease in caspase-3 levels, alongside restoration of BCL2
expression to near-normal levels (p<0.05). This observed
effect strongly supports the anti-apoptotic potential of
quercetin, highlighting its capacity to modulate apoptotic
signaling pathways (Figures 7 and 8). Figure 6. Hepatic tumor necrosis factor-alpha (TNF-α) levels (ng/mL).
The average hepatic TNF-α levels (ng/mL) among the four groups,
3.5. Histopathological findings expressed as mean ± standard error of the mean, are significant at p<0.05.
Notes: *refers to statistical significance between paracetamol versus
Histological analysis of liver tissue sections demonstrated the control group at p<0.05. refers to statistical significance between
#
distinct differences among the experimental groups. In quercetin versus the paracetamol group at p<0.05.
the control group (Figure 9A), the hepatic architecture
appeared normal, with well-preserved hepatocytes, clearly response. In addition, significant congestion of hepatic
defined lobular structures, and intact central veins and blood vessels was evident, suggesting vascular impairment
sinusoids. No signs of cellular damage, inflammation, or and circulatory disturbances due to paracetamol-induced
vascular abnormalities were observed. toxicity.
In contrast, the paracetamol-treated group (Figure 9B) The group receiving paracetamol and quercetin
exhibited extensive hepatocellular necrosis, characterized (Figure 9C) displayed moderate histological alterations,
by widespread loss of cellular integrity, nuclear pyknosis, with notably reduced hepatocyte necrosis and inflammation
and karyorrhexis. Inflammatory cell infiltration was compared to the paracetamol-only group. The hepatic
prominent, particularly around the central veins and lobular structure was partially preserved, and signs of
periportal regions, indicating a severe inflammatory tissue regeneration were apparent, suggesting a protective
Volume 9 Issue 2 (2025) 228 doi: 10.36922/ejmo.7873