
Page 260 - EJMO-9-2
P. 260
Eurasian Journal of
Medicine and Oncology The genetics of chronic stress in cervical lesions
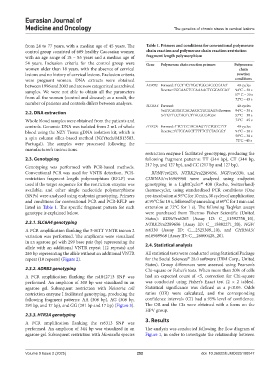
from 24 to 77 years, with a median age of 45 years. The Table 1. Primers and conditions for conventional polymerase
control group consisted of 609 healthy Caucasian women chain reaction and polymerase chain reaction‑restriction
with an age range of 18 – 85 years and a median age of fragment length polymorphism
54 years. Inclusion criteria for the control group were Gene Polymerase chain reaction primers Polymerase
women older than 18 years, with the absence of cervical chain
lesions and no history of cervical lesions. Exclusion criteria reaction
were pregnant women. DNA extracts were obtained conditions
between 1996 and 2003 and are now categorized as archived ADRB2 Forward: 5’CCTTCTTGCTGGCACCCCAA3’ 40 cycles
samples. We were not able to obtain all the parameters Reverse: 5’GGAAGTCCAAAACTCGCACCA3’ 94°C – 30 s
from all the women (control and disease); as a result, the 57° C – 30 s
72°C – 45 s
number of patients and controls differs between analyses. SLC6A4 Forward: 40 cycles
2.2. DNA extraction 5×GTCAGTATCACAGGCTGCGAG3×Reverse: 94°C – 30 s
5×TGTTCCTAGTCTTACGCCAG3×
57°C – 30 s
Whole blood samples were obtained from the patients and 72°C – 45 s
controls. Genomic DNA was isolated from 2 mL of whole HTR2A Forward: 5’TCTGCTACAAGTTCTGGCTT3’ 40 cycles
blood using the NZY Tissue gDNA isolation kit, which is Reverse: 5’CTGCAGCTTTTTCTCTAGGG3’ 94°C – 30 s
a spin column silica-based method (NZYtech/MB13503, 50°C – 30 s
72°C –45 s
Portugal). The samples were processed following the
manufacturer’s instructions.
restriction enzyme I facilitated genotyping, producing the
2.3. Genotyping following fragment patterns: TT (344 bp), CT (344 bp,
Genotyping was performed with PCR-based methods. 217 bp, and 127 bp), and CC (217 bp and 127 bp).
Conventional PCR was used for VNTR detection, PCR- BDNF/rs6265, NTRK2/rs2289656, NGF/rs6330, and
restriction fragment length polymorphism (RFLP) was CHRNA5/rs16969968 were analyzed using endpoint
used if the target sequence for the restriction enzyme was genotyping in a LightCycler 408 (Roche, Switzerland)
®
available, and other single nucleotide polymorphisms thermocycler, using standardized PCR conditions (One
(SNPs) were analyzed using endpoint genotyping. Primers pre-incubation at 95°C for 10 min, 30 cycles of amplification
and conditions for conventional PCR and PCR-RFLP are at 95°C for 10 s, followed by annealing at 60°C for 1 min and
listed in Table 1. The specific fragment pattern for each extension at 72°C for 1 s). The following TaqMan assays
genotype is explained below. were purchased from Thermo Fisher Scientific (United
States): BDNF/rs6265 (Assay ID: C__11592758_10),
2.3.1. SLC6A4 genotyping NTRK2/rs2289656 (Assay ID: C__15882271_20), NGF/
A PCR amplification flanking the 5-HTT VNTR intron 2 rs6330 (Assay ID: C__2525309_10), and CHRNA5/
variation was performed. The amplicons were visualized rs16969968 (Assay ID: C__26000428_20).
in an agarose gel with 299 base pair (bp) representing the
allele with an additional VNTR repeat (12 repeats) and 2.4. Statistical analysis
265 bp representing the allele without an additional VNTR All statistical tests were conducted using Statistical Package
repeat (10 repeats) (Figure 2). for the Social Sciences 28.0 software (IBM Corp., United
®
States). Group differences were assessed using Pearson’s
2.3.2. ADRB2 genotyping Chi-square or Fisher’s tests. When more than 20% of cells
A PCR amplification flanking the rs1042713 SNP was had an expected count of <5, correction for Chi-square
performed. An amplicon of 308 bp was visualized in an was conducted using Fisher’s Exact test (2 × 2 tables).
agarose gel. Subsequent restriction with Neisseria coli Statistical significance was defined as a p<0.05. Odds
restriction enzyme I facilitated genotyping, producing the ratios (OR) were calculated, and the corresponding
following fragment patterns: AA (308 bp), AG (308 bp, confidence intervals (CI) had a 95% level of confidence.
291 bp, and 17 bp), and GG (291 bp and 17 bp) (Figure 3). The OR and the CIs were obtained with a focus on the
HPV group.
2.3.3. HTR2A genotyping
3. Results
A PCR amplification flanking the rs6313 SNP was
performed. An amplicon of 344 bp was visualized in an The analysis was conducted following the flow diagram of
agarose gel. Subsequent restriction with Moraxella species Figure 1, in order to investigate the relationship between
Volume 9 Issue 2 (2025) 252 doi: 10.36922/EJMO025100047