
Page 88 - EJMO-9-2
P. 88
Eurasian Journal of Medicine and
Oncology
Cancer pathway ranking through odds ratios
facilitating the discovery of new treatment strategies, and
the development of targeted therapies aimed at disrupting
the aberrant signaling events that sustain tumor growth.
In summary, understanding the complex network
of PPIs and their roles in cancer is crucial for advancing
knowledge of tumor biology and developing more effective
cancer treatments. Advanced network analysis techniques
and statistical methods, such as the OR test, enable the
identification of key proteins and pathways integral to
cancer progression. While enhancing our understanding
of the molecular mechanisms driving cancer, findings
from such studies will provide critical insights into cancer
diagnosis, prognosis, and treatment, which are crucial
for the development of more personalized and targeted
therapies for patients. 19
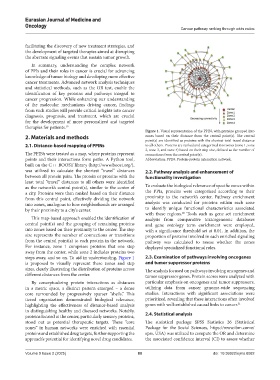
Figure 1. Visual representation of the PPIN, with proteins grouped into
2. Materials and methods zones based on their distance from the central point(s). The central
point(s) are identified as proteins with the shortest total travel distance
2.1. Distance-based mapping of PPINs to all others. Proteins are ranked and categorized into zones (zone 1, zone
2, zone 3, and zone 4) based on their step size, defined as the number of
The PPINs were treated as a map, where proteins represent connections from the central point(s).
points and their interactions form paths. A Python tool, Abbreviation: PPIN: Protein-protein interaction network.
built on the C++ BOOST library (http://www.boost.org/),
was utilized to calculate the shortest “travel” distances 2.2. Pathway analysis and enhancement of
between all protein pairs. The protein or proteins with the functionality investigation
least total “travel” distances to all others were identified
as the network’s central point(s), similar to the center of To evaluate the biological relevance of specific zones within
a city. Proteins were then ranked based on their distance the PPIs, proteins were categorized according to their
from this central point, effectively dividing the network proximity to the network’s center. Pathway enrichment
into zones, analogous to how neighborhoods are arranged analysis was conducted for proteins within each zone
by their proximity to a city’s center. to identify unique functional characteristics associated
20
with these regions. Tools such as gene set enrichment
This map-based approach enabled the identification of analysis from comparative toxicogenomic databases
central point(s) and the grouping of remaining proteins and gene ontology term enrichment were employed,
into zones based on their proximity to the center. The step with a significance threshold set at 0.01. In addition, the
size represents the number of connections or transitions proportion of proteins involved in each enriched signaling
from the central point(s) to each protein in the network. pathway was calculated to assess whether the zones
For instance, zone 1 comprises proteins that one step displayed specialized functional roles.
away from the center, while zone 2 includes proteins two
steps away, and so on. To aid in understanding, Figure 1 2.3. Examination of pathways involving oncogenes
is proposed to visually represent these zones and step and tumor suppressor proteins
sizes, clearly illustrating the distribution of proteins across The analysis focused on pathways involving oncogenes and
different distances from the center. tumor suppressor genes. Protein scores were analyzed with
By conceptualizing protein interactions as distances particular emphasis on oncogenes and tumor suppressors,
in a metric space, a distinct pattern emerged – a dense utilizing data from cancer genome-wide sequencing
core surrounded by progressively sparser “shells.” This studies. Interactions with significant associations were
tiered organization demonstrated biological relevance, prioritized, revealing that these interactions often involved
highlighting the effectiveness of distance-based analysis genes with well-established causal links to cancer. 21
in distinguishing healthy and diseased networks. Notably,
proteins located at the center, particularly sensory proteins, 2.4. Statistical analysis
stood out as potential therapeutic targets. These “core The statistical package SPSS Statistics 26 (Statistical
zones” in human networks were enriched with essential Package for the Social Sciences, https://www.ibm.come/
proteins and established drug targets, further supporting the spss, USA) was utilized to compute the OR and determine
approach’s potential for identifying novel drug candidates. the associated confidence interval (CI) to assess whether
Volume 9 Issue 2 (2025) 80 doi: 10.36922/ejmo.8082