
Page 99 - EJMO-9-2
P. 99
Eurasian Journal of Medicine and
Oncology
Dietary links between dairy, meat, and egg intake and pancreatic cancer risk
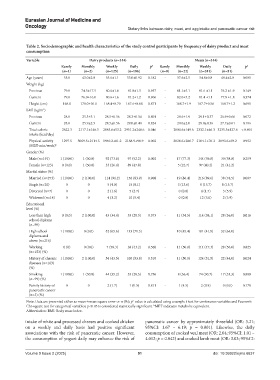
Table 2. Sociodemographic and health characteristics of the study control participants by frequency of dairy product and meat
consumption
Variable Dairy products (n=314) Meats (n=314)
Rarely Monthly Weekly Daily p* Rarely Monthly Weekly Daily p a
(n=1) (n=2) (n=125) (n=186) (n=0) (n=22) (n=241) (n=51)
Age (years) 55.0 43.0±2.0 55.6±1.1 53.0±0.92 0.182 - 57.6±2.5 54.8±0.8 48.4±2.0 0.001
Weight (kg)
Previous 79.0 74.5±17.5 80.6±1.6 81.0±1.3 0.957 - 81.1±5.1 81.6 ±1.1 76.2 ±1.9 0.149
Current 79.0 76.0±16.0 80.6±1.6 81.2±1.2 0.966 - 82.0±5.2 81.4 ±1.1 77.9 ±1.8 0.374
Height (cm) 168.0 170.0±10.0 168.4±0.70 167.6±0.68 0.871 - 168.7±1.9 167.7±0.56 168.7±1.2 0.691
BMI (kg/m )
2
Previous 28.0 25.3±3.1 28.5±0.56 28.3±0.54 0.801 - 28.6±1.9 29.1±0.37 26.9±0.66 0.072
Current 28.0 25.9±2.5 28.5±0.56 29.0±0.40 0.824 - 29.0±2.0 29.0±0.36 27.7±0.61 0.196
Total caloric 2622.3 2117.1±146.3 2085.6±53.2 2951.2±248.6 0.046 - 2000.6±149.6 2332.1±46.3 3235.5±127.6 < 0.001
intake (kcal/day)
Physical activity 1297.5 5069.5±2114.5 1940.2±81.2 2168.9±98.9 0.002 - 2026.6±206.7 2104.1±76.3 2093.6±69.2 0.952
(MET-min/week) b
Gender (%)
Male (n=191) 1 (100.0) 1 (50.0) 92 (73.6) 97 (52.2) 0.002 - 17 (77.3) 144 (59.8) 30 (58.8) 0.259
Female (n=123) 0 (0.0) 1 (50.0) 33 (26.4) 89 (47.8) - 5 (22.7) 97 (40.2) 21 (41.2)
Marital status (%)
Married (n=273) 1 (100.0) 2 (100.0) 114 (91.2) 156 (83.9) 0.908 - 19 (86.4) 216 (89.6) 38 (74.5) 0.007
Single (n=20) 0 0 5 (4.0) 15 (8.1) - 3 (13.6) 8 (15.7) 8 (15.7)
Divorced (n=7) 0 0 2 (1.6) 5 (2.7) - 0 (0.0) 4 (1.7) 3 (5.9)
Widowed (n=14) 0 0 4 (3.2) 10 (5.4) - 0 (0.0) 12 (5.0) 2 (3.9)
Educational
level (%)
Less than high 0 (0.0) 2 (100.0) 43 (34.4) 53 (28.5) 0.573 - 11 (54.5) 114 (58.1) 28 (36.0) 0.016
school diploma
(n=98)
High school 1 (100.0) 0 (0.0) 82 (65.6) 133 (71.5) - 10 (45.4) 101 (41.9) 32 (64.0)
diploma and
above (n=216)
Working 0 (0) 0 (0.0) 7 (58.3) 38 (43.2) 0.560 - 11 (50.0) 114 (47.3) 28 (56.0) 0.825
(n=153) (%)
History of chronic 1 (100.0) 2 (100.0) 54 (43.5) 100 (53.8) 0.510 - 11 (50.0) 124 (51.5) 22 (44.0) 0.024
diseases (n=163)
(%)
Smoking 1 (100.0) 1 (50.0) 44 (35.2) 53 (28.5) 0.756 - 8 (36.4) 74 (30.7) 17 (33.3) 0.808
(n=99) (%)
Family history of 0 0 2 (1.7) 1 (0.5) 0.811 - 1 (4.5) 2 (0.9) 0 (0.0) 0.178
pancreatic cancer
(n=3) (%)
Note: Data are presented either as mean±mean square error or n (%); p -value is calculated using a sample t-test for continuous variables and Pearson’s
a
Chi-square test for categorical variables; p<0.05 is considered statistically significant. MET indicates metabolic equivalent.
b
Abbreviation: BMI: Body mass index.
intake of white and processed cheeses and cooked chicken pancreatic cancer by approximately threefold (OR: 3.21;
on a weekly and daily basis had positive significant 95%CI: 1.67 – 6.19; p = 0.001). Likewise, the daily
associations with the risk of pancreatic cancer. However, consumption of cooked veal meat (OR: 2.04; 95%CI: 1.01 –
the consumption of yogurt daily may enhance the risk of 4.012; p = 0.042) and cooked lamb meat (OR: 3.03; 95%CI:
Volume 9 Issue 2 (2025) 91 doi: 10.36922/ejmo.6637