
Page 102 - EJMO-9-2
P. 102
Eurasian Journal of Medicine and
Oncology
Dietary links between dairy, meat, and egg intake and pancreatic cancer risk
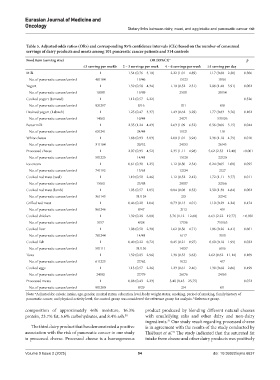
Table 5. Adjusted odds ratios (ORs) and corresponding 95% confidence intervals (CIs) based on the number of consumed
servings of dairy products and meats among 101 pancreatic cancer patients and 314 controls
Food item (serving size) OR (95%CI) a p
≤1 serving per weekb 2 – 3 servings per week 4 – 6 servings per week ≥1 serving per day
Milk 1 1.54 (0.76 – 3.10) 2.22 (1.01 – 4.89) 1.17 (0.60 – 2.30) 0.306
No. of pancreatic cancer/control 48/184 19/46 15/23 19/61
Yogurt 1 1.59 (0.58 – 4.34) 1.10 (0.52 – 2.31) 2.88 (1.40 – 5.91) 0.002
No. of pancreatic cancer/control 18/80 19/89 25/91 39/54
Cooked yogurt (Jameed) 1 1.12 (0.57 – 2.22) - - 0.326
No. of pancreatic cancer/control 93/297 8/16 0/1 0/0
Drained yogurt (Labneh) 1 1.25 (0.47 – 3.37) 1.43 (0.62 – 3.29) 1.77 (0.83 – 3.76) 0.102
No. of pancreatic cancer/control 14/63 10/44 24/71 53/136
Buttermilk 1 2.35 (1.24 – 4.43) 2.63 (1.09 – 6.32) 0.56 (0.06 – 5.15) 0.044
No. of pancreatic cancer/control 65/241 24/44 11/21 1/8
White cheese 1 1.88 (0.93 – 3.83) 2.00 (1.01 – 3.94) 2.38 (1.18 – 4.79) 0.010
No. of pancreatic cancer/control 31/164 20/52 24/53 26/45
Processed cheese 1 2.07 (0.95 – 4.52) 2.35 (1.11 – 4.98) 5.62 (2.53 – 12.48) <0.001
No. of pancreatic cancer/control 50/225 14/41 15/28 22/20
Ice cream 1 0.61 (0.30 – 1.25) 1.12 (0.50 – 2.54) 0.24 (0.05 – 1.08) 0.095
No. of pancreatic cancer/control 74/192 13/61 12/34 2/27
Cooked red meat (veal) 1 1.10 (0.50 – 2.46) 1.12 (0.52 – 2.42) 1.72 (1.11 – 3.77) 0.011
No. of pancreatic cancer/control 15/63 25/88 29/97 32/66
Cooked red meat (lamb) 1 1.03 (0.57 – 1.85) 0.84 (0.08 – 8.33) 2.50 (1.30 – 4.84) 0.002
No. of pancreatic cancer/control 36/143 31/124 2/5 32/42
Grilled red meat 1 0.46 (0.20 – 1.04) 0.73 (0.13 – 4.01) 1.10 (0.29 – 4.24) 0.474
No. of pancreatic cancer/control 86/246 9/47 2/12 4/9
Cooked chicken 1 1.39 (0.29 – 6.80) 3.76 (1.12 – 12.60) 6.63 (2.22 – 19.77) < 0.001
No. of pancreatic cancer/control 5/57 4/38 17/56 75/163
Cooked liver 1 1.08 (0.50 – 2.30) 1.62 (0.56 – 4.71) 1.06 (0.26 – 4.41) 0.601
No. of pancreatic cancer/control 78/244 14/41 6/17 3/10
Cooked fish 1 0.40 (0.22 – 0.72) 0.45 (0.21 – 0.97) 0.60 (0.18 – 1.99) 0.032
No. of pancreatic cancer/control 50/111 31/130 14/57 6/16
Tuna 1 1.59 (0.85 – 2.96) 1.38 (0.53 – 3.63) 2.62 (0.62 – 11.14) 0.109
No. of pancreatic cancer/control 61/223 27/62 9/22 4/7
Cooked eggs 1 1.13 (0.57 – 2.26) 1.23 (0.61 – 2.46) 1.39 (0.68 – 2.86) 0.499
No. of pancreatic cancer/control 24/93 27/79 26/76 24/65
Processed meats 1 0.98 (0.43 – 2.23) 3.40 (0.45 – 25.75) - 0.072
No. of pancreatic cancer/control 90/280 9/29 2/4 0/1
a
Note: Adjusted for caloric intake, age, gender, marital status, education level, body weight status, smoking, period of smoking, family history of
pancreatic cancer, and physical activity level; the control group was considered the reference group for analysis. Reference group.
b
composition of approximately 46% moisture, 16.3% product produced by blending different natural cheeses
protein, 23.7% fat, 5.6% carbohydrates, and 8.4% ash. 30 with emulsifying salts and other dairy and non-dairy
ingredients. Our study result regarding processed cheese
31
The third dairy product that has demonstrated a positive is in agreement with the results of the study conducted by
association with the risk of pancreatic cancer in our study Thiébaut et al. The study indicated that the saturated fat
32
is processed cheese. Processed cheese is a homogeneous intake from cheese and other dairy products was positively
Volume 9 Issue 2 (2025) 94 doi: 10.36922/ejmo.6637