
Page 101 - EJMO-9-2
P. 101
Eurasian Journal of Medicine and
Oncology
Dietary links between dairy, meat, and egg intake and pancreatic cancer risk
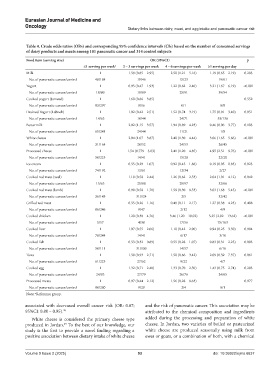
Table 4. Crude odds ratios (ORs) and corresponding 95% confidence intervals (CIs) based on the number of consumed servings
of dairy products and meats among 101 pancreatic cancer and 314 control subjects
Food item (serving size) OR (95%CI) p
≤1 serving per week a 2 – 3 servings per week 4 – 6 servings per week ≥1 serving per day
Milk 1 1.58 (0.85 – 2.95) 2.50 (1.21 – 5.16) 1.19 (0.65 – 2.19) 0.203
No. of pancreatic cancer/control 48/184 19/46 15/23 19/61
Yogurt 1 0.95 (0.47 – 1.93) 1.22 (0.62 – 2.40) 3.21 (1.67 – 6.19) <0.001
No. of pancreatic cancer/control 18/80 19/89 25/91 39/54
Cooked yogurt (Jameed) 1 1.60 (0.66 – 3.85) - - 0.552
No. of pancreatic cancer/control 93/297 8/16 0/1 0/0
Drained Yogurt (Labneh) 1 1.02 (0.42 – 2.51) 1.52 (0.74 – 3.19) 1.75 (0.91 – 3.40) 0.051
No. of pancreatic cancer/control 14/63 10/44 24/71 53/136
Buttermilk 1 2.02 (1.15 – 3.57) 1.94 (0.89 – 4.23) 0.46 (0.06 – 3.77) 0.103
No. of pancreatic cancer/control 65/241 24/44 11/21 1/8
White cheese 1 2.04 (1.07 – 3.87) 2.40 (1.30 – 4.44) 3.06 (1.65 – 5.66) <0.001
No. of pancreatic cancer/control 31/164 20/52 24/53 26/45
Processed cheese 1 1.54 (0.779 – 3.03) 2.41 (1.20 – 4.85) 4.95 (2.51 – 9.76) <0.001
No. of pancreatic cancer/control 50/225 14/41 15/28 22/20
Ice cream 1 0.55 (0.29 – 1.07) 0.92 (0.45 – 1.86) 0.19 (0.05 – 0.83) 0.023
No. of pancreatic cancer/control 74/192 13/61 12/34 2/27
Cooked red meat (veal) 1 1.19 (0.58 – 2.44) 1.26 (0.62 – 2.53) 2.04 (1.01 – 4.12) 0.042
No. of pancreatic cancer/control 15/63 25/88 29/97 32/66
Cooked red meat (lamb) 1 0.99 (0.58 – 1.70) 1.59 (0.30 – 8.53) 3.03 (1.68 – 5.45) <0.001
No. of pancreatic cancer/control 36/143 31/124 2/5 32/42
Grilled red meat 1 0.55 (0.26 – 1.16) 0.48 (0.11 – 2.17) 1.27 (0.38 – 4.23) 0.408
No. of pancreatic cancer/control 86/246 9/47 2/12 4/9
Cooked chicken 1 1.20 (0.30 – 4.76) 3.46 (1.20 – 10.02) 5.25 (2.02 – 13.62) <0.001
No. of pancreatic cancer/control 5/57 4/38 17/56 75/163
Cooked liver 1 1.07 (0.55 – 2.06) 1.10 (0.42 – 2.90) 0.94 (0.25 – 3.50) 0.904
No. of pancreatic cancer/control 78/244 14/41 6/17 3/10
Cooked fish 1 0.53 (0.32 – 0.89) 0.55 (0.28 – 1.07) 0.83 (0.31 – 2.25) 0.093
No. of pancreatic cancer/control 50/111 31/130 14/57 6/16
Tuna 1 1.59 (0.93 – 2.71) 1.50 (0.66 – 3.42) 2.09 (0.59 – 7.37) 0.061
No. of pancreatic cancer/control 61/223 27/62 9/22 4/7
Cooked egg 1 1.32 (0.71 – 2.48) 1.33 (0.70 – 2.50) 1.43 (0.75 – 2.74) 0.293
No. of pancreatic cancer/control 24/93 27/79 26/76 24/65
Processed meats 1 0.97 (0.44 – 2.12) 1.56 (0.28 – 8.63) - 0.977
No. of pancreatic cancer/control 90/280 9/29 2/4 0/1
Note: Reference group.
a
associated with decreased overall cancer risk (OR: 0.87; and the risk of pancreatic cancer. This association may be
95%CI: 0.80 – 0.95). 28 attributed to the chemical composition and ingredients
White cheese is considered the primary cheese type added during the processing and preparation of white
produced in Jordan. To the best of our knowledge, our cheese. In Jordan, two varieties of boiled or pasteurized
29
study is the first to provide a novel finding regarding a white cheese are produced seasonally using milk from
positive association between dietary intake of white cheese ewes or goats, or a combination of both, with a chemical
Volume 9 Issue 2 (2025) 93 doi: 10.36922/ejmo.6637