
Page 98 - EJMO-9-2
P. 98
Eurasian Journal of Medicine and
Oncology
Dietary links between dairy, meat, and egg intake and pancreatic cancer risk
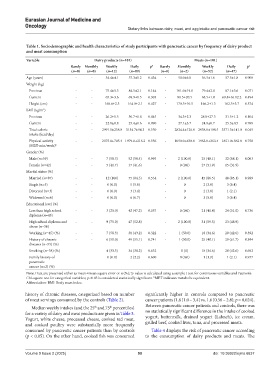
Table 1. Sociodemographic and health characteristics of study participants with pancreatic cancer by frequency of dairy product
and meat consumption
Variable Dairy products (n=101) Meats (n=101)
Rarely Monthly Weekly Daily p* Rarely Monthly Weekly Daily p a
(n=0) (n=0) (n=12) (n=89) (n=0) (n=2) (n=52) (n=47)
Age (years) - - 54.4±4.1 57.3±1.2 0.434 - 58.0±6.0 56.5±1.6 57.5±1.8 0.908
Weight (kg)
Previous - - 75.4±5.3 84.5±2.1 0.144 - 101.0±19.0 79.4±2.0 87.1±3.6 0.071
Current - - 65.3±3.6 69.9±1.5 0.303 - 80.5±20.5 68.5±1.8 69.8±16.12.2 0.494
Height (cm) - - 168.6±2.3 164.0±2.1 0.427 - 170.5±10.5 166.2±1.3 162.5±3.7 0.574
2
BMI (kg/m )
Previous - - 26.2±1.5 30.7±0.8 0.045 - 34.3±2.3 28.8±27.3 31.5±1.2 0.104
Current - - 22.8±0.8 25.4±0.6 0.090 - 27.1±3.7 24.9±0.7 25.3±0.5 0.789
Total caloric - - 2991.1±258.8 3154.7±94.3 0.550 - 2824.4±126.0 2938.0±108.5 3371.3±141.0 0.045
intake (kcal/day)
Physical activity - - 2375.0±705.4 1979.0±216.2 0.556 - 1050.0±630.0 1965.0±263.4 1851.0±362.8 0.758
(MET-min/week) b
Gender (%)
Male (n=59) - - 7 (58.3) 52 (58.4) 0.995 - 2 (100.0) 25 (48.1) 32 (68.1) 0.063
Female (n=42) - - 5 (41.7) 37 (41.6) - 0 (0.0) 27 (51.9) 15 (31.9)
Marital status (%)
Married (n=87) - - 12 (100) 75 (84.3) 0.534 - 2 (100.0) 45 (86.5) 40 (85.1) 0.989
Single (n=5) - - 0 (0.0) 5 (5.6) - 0 2 (3.8) 3 (6.4)
Divorced (n=3) - - 0 (0.0) 3 (3.4) - 0 2 (3.8) 1 (2.1)
Widowed (n=6) - - 0 (0.0) 6 (6.7) - 0 3 (5.8) 3 (6.4)
Educational level (%)
Less than high school - - 3 (25.0) 42 (47.2) 0.057 - 0 (0.0) 21 (40.4) 24 (51.0) 0.736
diploma (n=45)
High school diploma and - - 9 (75.0) 47 (52.8) - 2 (100.0) 31 (59.5) 23 (48.9)
above (n=56)
Working (n=45) (%) - - 7 (58.3) 38 (43.2) 0.322 - 1 (50.0) 18 (34.6) 20 (42.6) 0.392
History of chronic - - 6 (50.0) 49 (55.1) 0.741 - 1 (50.0) 25 (48.1) 29 (61.7) 0.394
diseases (n=55) (%)
Smoking (n=38) (%) - - 4 (33.3) 34 (38.2) 0.632 - 0 (0) 18 (34.6) 20 (42.6) 0.692
Family history of - - 0 (0.0) 2 (2.2) 0.600 - 0 (0.0) 1 (1.9) 1 (2.1) 0.977
pancreatic
cancer (n=2) (%)
Note: Data are presented either as mean±mean square error or n (%); p-value is calculated using a sample t-test for continuous variables and Pearson’s
a
Chi-square test for categorical variables; p<0.05 is considered statistically significant. MET indicates metabolic equivalent.
b
Abbreviation: BMI: Body mass index.
history of chronic diseases, categorized based on number significantly higher in controls compared to pancreatic
of meat servings consumed by the controls (Table 2). cancer patients (1.8 [1.0 – 3.4] vs. 1.6 [0.56 – 2.8]; p = 0.024).
th
th
Median weekly intakes (and the 25 and 75 percentiles) Between pancreatic cancer patients and controls, there was
for a variety of dairy and meat products are given in Table 3. no statistically significant difference in the intake of cooked
Yogurt, white cheese, processed cheese, cooked red meat, yogurt, buttermilk, drained yogurt (Labneh), ice cream,
and cooked poultry were substantially more frequently grilled beef, cooked liver, tuna, and processed meats.
consumed by pancreatic cancer patients than by controls Table 4 displays the risk of pancreatic cancer according
(p < 0.05). On the other hand, cooked fish was consumed to the consumption of dairy products and meats. The
Volume 9 Issue 2 (2025) 90 doi: 10.36922/ejmo.6637