
Page 111 - EJMO-9-3
P. 111
Eurasian Journal of
Medicine and Oncology Vitamin D and breast cancer
2.3. Selection and validation of instrumental meet the requirements of the TwoSampleMR software
variables package. Such a software-specific data preparation step was
Firstly, within the GWAS database, which focused crucial as it laid the foundation for the subsequent in-depth
specifically on exposure factors, this study implemented a analysis. The research then employed the two-sample MR
stringent screening criterion. The p-values were required analysis method, which is a powerful tool for establishing
to be <0.05. This is a significant threshold as it helps filter causal relationships between exposures and outcomes. To
out genetic variants that may not have an adequately strong explore the potential correlation between Vitamin D levels
association with the factors under study. In addition to the and breast cancer, multiple sophisticated methods were
utilized. These included the inverse variance-weighted
p-value criterion, a linkage disequilibrium threshold was (IVW), MR-Egger, weighted median, simple mode, and
set at 0.001. Linkage disequilibrium is a crucial concept in weighted mode. In the IVW method, a detailed statistical
genetics, and by setting this low threshold, the study aimed examination was conducted. After a series of calculations
to ensure a high level of precision in identifying truly and model fittings, it was determined that there is no
associated genetic variants. Moreover, a clustering window significant association between Vitamin D and breast
of 10,000 kb was defined. This clustering window played cancer. The IVW results clearly showed that p=0.968, with
an important role in excluding SNPs that did not meet the an odds ratio (OR) of 1.002 and a 95% confidence interval
conditions above. After this preliminary and meticulous (CI) ranging from 0.896 to 1.119. This indicates that, within
screening process, the study was able to identify 117 SNPs the scope of this analysis, changes in Vitamin D levels do
that were associated with Vitamin D. This was a significant not have a significant impact on the odds of developing
finding as it provided a starting point for further analysis. breast cancer. Similarly, when applying the other methods,
Subsequently, these identified SNPs were matched with no correlations were detected. The MR-Egger (p=0.482,
the research results. This matching step was essential as it OR: 1.004, CI: 0.844 – 1.194), weighted median (p=0.519,
allowed for a more in-depth exploration of the relationship OR: 1.048, CI: 0.907 – 1.210), simple mode (p=0.965, OR:
between these SNPs and other relevant factors. After 0.992, CI: 0.703 – 1.400), and weighted mode (p=0.650, OR:
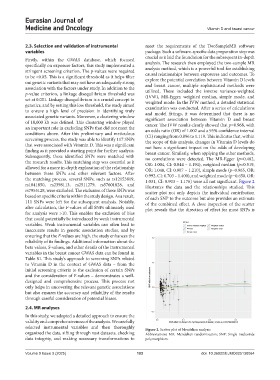
the matching process, several SNPs, such as rs12153819, 1.031, CI: 0.903 – 1.176) were all not significant. Figure 2
rs1841850, rs2398113, rs2511279, rs57601828, and illustrates the data and the relationships studied. This
rs7955128, were excluded. The exclusion of these SNPs was scatter plot not only depicts the individual contribution
based on specific criteria within the study design. As a result, of each SNP to the outcome but also provides an estimate
111 SNPs were left for the subsequent analysis. Notably, of the combined effect. A close inspection of the scatter
after calculation, the F-values of all SNPs ultimately used plot reveals that the direction of effect for most SNPs is
for analysis were >10. This enables the exclusion of bias
that could potentially be introduced by weak instrumental
variables. Weak instrumental variables can often lead to
inaccurate results in genetic association studies, and by
ensuring that the F-values are high, the study enhances the
reliability of its findings. Additional information about the
beta values, S-values, and other details of the instrumental
variables in the breast cancer GWAS data can be found in
Table S1. This study’s approach to screening SNPs related
to Vitamin D in the context of GWAS data – from the
initial screening criteria to the exclusion of certain SNPs
and the consideration of F-values – demonstrates a well-
designed and comprehensive process. This process not
only helps in uncovering the relevant genetic associations
but also ensures the accuracy and reliability of the results
through careful consideration of potential biases.
2.4. MR analyses
In this study, we adopted a detailed approach to ensure the
validity and comprehensiveness of the analysis. We carefully
selected instrumental variables and then thoroughly Figure 2. Scatter plot of Mendelian analysis
organized the data, sifting through vast datasets, checking Abbreviations: MR: Mendelian randomization; SNP: Single nucleotide
data integrity, and making necessary transformations to polymorphism.
Volume 9 Issue 3 (2025) 103 doi: 10.36922/EJMO025130064