
Page 112 - EJMO-9-3
P. 112
Eurasian Journal of
Medicine and Oncology Vitamin D and breast cancer
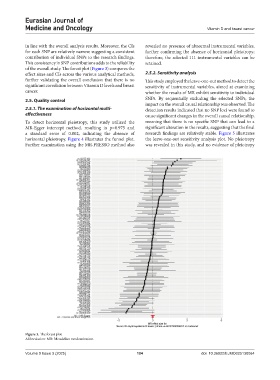
in line with the overall analysis results. Moreover, the CIs revealed no presence of abnormal instrumental variables,
for each SNP are relatively narrow, suggesting a consistent further confirming the absence of horizontal pleiotropy;
contribution of individual SNPs to the research findings. therefore, the selected 111 instrumental variables can be
This consistency in SNP contributions adds to the reliability retained.
of the overall study. The forest plot (Figure 3) compares the
effect sizes and CIs across the various analytical methods, 2.5.2. Sensitivity analysis
further validating the overall conclusion that there is no This study employed the leave-one-out method to detect the
significant correlation between Vitamin D levels and breast sensitivity of instrumental variables, aimed at examining
cancer. whether the results of MR exhibit sensitivity to individual
2.5. Quality control SNPs. By sequentially excluding the selected SNPs, the
impact on the overall causal relationship was observed. The
2.5.1. The examination of horizontal multi- detection results indicated that no SNP loci were found to
effectiveness cause significant changes in the overall causal relationship,
To detect horizontal pleiotropy, this study utilized the meaning that there is no specific SNP that can lead to a
MR-Egger intercept method, resulting in p=0.975 and significant alteration in the results, suggesting that the final
a standard error of 0.002, indicating the absence of research findings are relatively stable. Figure 5 illustrates
horizontal pleiotropy. Figure 4 illustrates the funnel plot. the leave-one-out sensitivity analysis plot. No pleiotropy
Further examination using the MR-PRESSO method also was revealed in this study, and no evidence of pleiotropy
Figure 3. The forest plot
Abbreviation: MR: Mendelian randomization.
Volume 9 Issue 3 (2025) 104 doi: 10.36922/EJMO025130064