
Page 149 - EJMO-9-3
P. 149
Eurasian Journal of
Medicine and Oncology CRCI factors in breast cancer
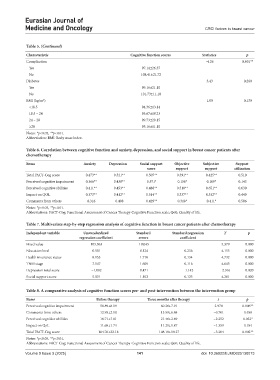
Table 5. (Continued)
Characteristic Cognitive function scores Statistics p
Complication -4.26 0.001**
Yes 97.14±26.37
No 108.41±21.72
Diabetes 3.43 0.260
Yes 99.16±21.10
No 101.73±11.10
BMI (kg/m ) 1.09 0.130
2
<18.5 94.36±13.14
18.5 – 24 93.67±18.23
24 – 28 99.73±20.15
≥28 95.16±11.10
Notes: *p<0.05, **p<0.01.
Abbreviation: BMI: Body mass index.
Table 6. Correlation between cognitive function and anxiety, depression, and social support in breast cancer patients after
chemotherapy
Items Anxiety Depression Social support Objective Subjective Support
score support support utilization
Total FACT-Cog score −0.473** −0.521** 0.507** 0.391** 0.425** 0.510
Perceived cognitive impairment −0.366** −0.438** 0.571* 0.156* 0.169* 0.143
Perceived cognitive abilities −0.411** −0.453** 0.488** 0.510** 0.651** 0.630
Impact on QOL −0.373** −0.412** 0.514** 0.337** 0.332** 0.449
Comments from others −0.316 −0.408 0.429** 0.318* 0.411* 0.506
Notes: *p<0.05, **p<0.01.
Abbreviations: FACT-Cog: Functional Assessment of Cancer Therapy-Cognitive Function scale; QoL: Quality of life.
Table 7. Multivariate step‑by‑step regression analysis of cognitive function in breast cancer patients after chemotherapy
Independent variable Unstandardized Standard Standard regression T p
regression coefficient errors coefficient
Fixed value 105.063 19.045 — 5.379 0.000
Education level 0.501 0.124 0.236 4.155 0.000
Health insurance status 8.153 1.718 0.134 4.732 0.000
TNM stage 7.147 1.609 0.116 4.643 0.000
Depression total score −1.082 0.471 -1.142 -2.316 0.020
Social support score 5.031 1.102 0.123 4.201 0.000
Table 8. A comparative analysis of cognitive function scores pre‑ and post‑intervention between the intervention group
Items Before therapy Three months after therapy t p
Perceived cognitive impairment 58.89±8.19 60.26±7.91 2.978 0.006**
Comments from others 12.95±2.10 13.59±6.68 −0.701 0.488
Perceived cognitive abilities 18.71±7.01 21.46±2.89 −2.252 0.032*
Impact on QoL 11.68±1.74 11.21±1.87 −1.359 0.184
Total FACT-Cog score 104.76±22.18 108.18±18.27 −3.304 0.002**
Notes: *p<0.05, **p<0.01.
Abbreviations: FACT-Cog: Functional Assessment of Cancer Therapy-Cognitive Function scale; QoL: Quality of life.
Volume 9 Issue 3 (2025) 141 doi: 10.36922/EJMO025130073