
Page 262 - EJMO-9-3
P. 262
Eurasian Journal of
Medicine and Oncology Metastasis gene expression in colorectal cancer
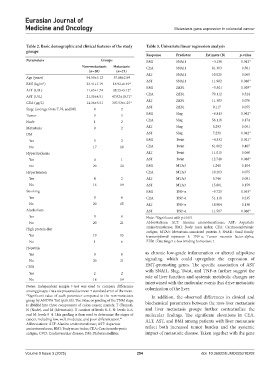
Table 2. Basic demographic and clinical features of the study Table 3. Univariate linear regression analysis
groups
Response Predictor Estimate (B) p‑value
Parameters Groups BMI SNAI1 −3.156 0.012*
Non‑metastasis Metastasis CEA SNAI1 81.303 0.501
(n=20) (n=21)
Age (years) 54.50±3.12 57.08±2.99 ALT SNAI1 10.025 0.065
AST SNAI1 11.982 0.046*
2
BMI (kg/m ) 23.41±1.19 18.92±0.49*
BMI ZEB1 −5.501 0.029*
ALT (U/L) 11.65±1.74 28.25±5.12*
CEA ZEB1 70.112 0.524
AST (U/L) 21.35±4.51 47.92±10.71*
CEA (μg/L) 14.36±5.51 307.53±1.27* ALT ZEB1 11.383 0.070
AST ZEB1 9.117 0.055
Stage (average from T, N, and M) 4 2
Tumor 3 5 BMI Slug −6.813 0.042*
Node 1 2 CEA Slug 56.118 0.174
Metastasis 0 2 ALT Slug 5.293 0.091
DM AST Slug 7.231 0.042*
Yes 3 2 BMI Twist −4.532 0.021*
No 17 19 CEA Twist 61.002 0.407
Hyperlipidemia ALT Twist 11.015 0.060
Yes 0 1 AST Twist 12.740 0.048*
No 20 20 BMI MTA3 1.241 0.104
Hypertension CEA MTA3 10.203 0.075
Yes 4 2 ALT MTA3 5.746 0.081
No 16 19 AST MTA3 15.801 0.159
Smoking BMI TNF-α −9.725 0.033*
Yes 0 6 CEA TNF-α 51.118 0.235
No 20 15 ALT TNF-α 18.964 0.136
Alcoholism AST TNF-α 11.507 0.046*
Yes 0 0 Note: *Significant with p≤0.05.
No 20 21 Abbreviations: ALT: Alanine aminotransferase; AST: Aspartate
High protein diet aminotransferase; BMI: Body mass index; CEA: Carcinoembryonic
antigen; MTA3: Metastasis-associated protein 3; SNAI1: Snail family
Yes 19 15 transcriptional repressor 1; TNF-α: Tumor necrosis factor-alpha;
No 1 6 ZEB1: Zinc finger e-box binding homeobox 1.
Hepatitis
Yes 0 0 as chronic low-grade inflammation or altered adipokine
No 20 21 signaling, which could upregulate the expression of
CVD EMT-promoting genes. The specific association of AST
Yes 2 2 with SNAI1, Slug, Twist, and TNF-α further suggest the
role of liver function and systemic metabolic changes are
No 18 19 intertwined with the molecular events that drive metastatic
Notes: Independent sample t-test was used to compare differences colonization of the liver.
among groups. Data are presented as mean ± standard error of the mean.
*Significant value of each parameter compared to the non-metastasis In addition, the observed differences in clinical and
group by ANOVA Test (p≤0.05). The value or grading of the TNM stage biochemical parameters between the non-liver metastasis
is divided into three components of colon cancer, namely, T (Tumor),
N (Node), and M (Metastasis). T consists of levels 0–5, N: levels 0–6, and liver metastasis groups further contextualize the
and M: levels 0–4. This grading is then used to determine the stages of molecular findings. The significant elevations in CEA,
cancer, including low, well, moderate, and poor differentiation. 41 ALT, AST, and BMI among patients with liver metastasis
Abbreviations: ALT: Alanine aminotransferase; AST: Aspartate
aminotransferase; BMI: Body mass index; CEA: Carcinoembryonic reflect both increased tumor burden and the systemic
antigen; CVD: Cardiovascular disease; DM: Diabetes mellitus. impact of metastatic disease. Taken together with the gene
Volume 9 Issue 3 (2025) 254 doi: 10.36922/EJMO025210202