
Page 85 - EJMO-9-3
P. 85
Eurasian Journal of
Medicine and Oncology Mapping breast cancer PPI networks for targets
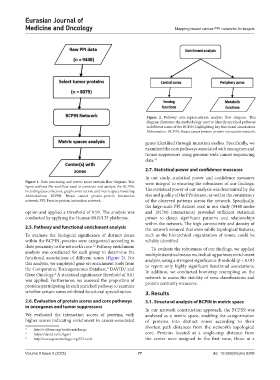
Figure 2. Pathway over-representation analysis flow diagram. This
diagram illustrates the methodology used to identify enriched pathways
in different zones of the BCPIN, highlighting key functional associations
Abbreviation: BCPIN: Breast cancer protein-protein interaction network.
genes identified through mutation studies. Specifically, we
examined the core pathways associated with oncogenes and
tumor suppressors using genome-wide cancer sequencing
data. 23
2.7. Statistical power and confidence measures
In our study, statistical power and confidence measures
Figure 1. Data processing and metric space analysis flow diagram. This were integral to ensuring the robustness of our findings.
figure outlines the workflow used to construct and analyze the BCPIN, The statistical power of our analysis was determined by the
including data collection, graph construction, and metric space modeling
Abbreviations: BCPIN: Breast cancer protein-protein interaction size and quality of the PPI dataset, as well as the consistency
network; PPI: Protein-protein interaction network. of the observed patterns across the network. Specifically,
the large-scale PPI dataset used in our study (9448 nodes
option and applied a threshold of 0.99. The analysis was and 181706 interactions) provided sufficient statistical
conducted by applying the Human HGU133 platforms. power to detect significant patterns and relationships
within the network. The high connectivity and density of
2.5. Pathway and functional enrichment analysis the network ensured that even subtle topological features,
To evaluate the biological significance of distinct zones such as the hierarchical organization of zones, could be
within the BCPIN, proteins were categorized according to reliably identified.
their proximity to the network’s core. Pathway enrichment To evaluate the robustness of our findings, we applied
22
analysis was conducted for each group to determine the multiple statistical measures, including pathway enrichment
functional associations of different zones (Figure 2). For analysis, using a stringent significance threshold (p < 0.01)
this analysis, we employed gene set enrichment tools from to report only highly significant functional associations.
the Comparative Toxicogenomics Database, DAVID, and In addition, we conducted bootstrap resampling on the
2
3
Gene Ontology. A statistical significance threshold of 0.01 network to assess the stability of zone classifications and
4
was applied. Furthermore, we assessed the proportion of protein centrality measures.
proteins participating in each enriched pathway to examine
whether certain zones exhibited functional specialization. 3. Results
2.6. Evaluation of protein scores and core pathways 3.1. Structural analysis of BCPIN in metric space
in oncogenes and tumor suppressors
In our network construction approach, the BCPIN was
We evaluated the interaction scores of proteins, with analyzed as a metric space, enabling the categorization
higher scores indicating enrichment in cancer-associated of proteins into distinct zones according to their
shortest path distances from the network’s topological
2 http://ctdbase.org/tools/enricher.go
3 https://david.ncifcrf.gov/ core. Proteins located at a single-step distance from
4 http://www.geneontology.org/GO.tools the center were assigned to the first zone, those at a
Volume 9 Issue 3 (2025) 77 doi: 10.36922/ejmo.8208