
Page 80 - GHES-1-2
P. 80
Global Health Econ Sustain Imports of essential medical products
2020 and the value 0 indicates otherwise; and expected 2 partners (one extra-EU and one intra-EU), spanning
values of β β β >0, and of β <0. 6 years (2015 – 2020). Table 1 presents the main statistics
4
2, 3, 5
In the field of international trade, numerous previous of the variables that make up the equations for the panel
studies have employed regression models with panel data sample. In addition, two dummies are included: One
estimated by pooled OLS, FE, and RE (Karagoz & Saray, represents the intra- or extra-EU origin of the products,
2010; Manwa et al., 2019; Tran et al., 2020; Majumder et al., and the other captures whether COVID-19 had had a
2020, among others). The Breusch-Pagan and Hausman notable effect on the trade in these goods. All variables
tests were used to determine the most appropriate were sourced from Eurostat.
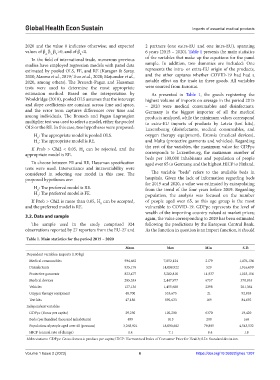
estimation method. Based on the interpretation by As presented in Table 1, the goods registering the
Wooldridge (2010), pooled OLS assumes that the intercept highest volume of imports on average in the period 2015
and slope coefficients are constant across time and space, – 2020 were medical consumables and disinfectants.
and the error term captures differences over time and Germany is the biggest importer of all the medical
among individuals. The Breusch and Pagan Lagrangian products analyzed, while the minimum values correspond
multiplier test was used to select a model, either the pooled to extra-EU imports of products by Latvia (test kits),
OLS or the RE. In this case, two hypotheses were proposed: Luxembourg (disinfectants, medical consumables, and
H : The appropriate model is pooled OLS. oxygen therapy equipment), Estonia (medical devices),
0
H : The appropriate model is RE. and Malta (protective garments and vehicles). Regarding
1
If Prob > Chi2 < 0.05, H can be rejected, and the the rest of the variables, the maximum value for GDPpc
0
appropriate model is RE. corresponds to Luxembourg, the maximum number of
beds per 100,000 inhabitants and population of people
To choose between FE and RE, Hausman specification aged over 65 to Germany, and the highest HICP to Finland.
tests were used. Intervariance and intravariability were
considered in selecting one model in this case. The The variable “beds” refers to the available beds in
proposed hypotheses are: hospitals. Given the lack of information regarding beds
for 2019 and 2020, a value was estimated by extrapolating
H : The preferred model is RE. from the trend of the four years before 2019. Regarding
0
H : The preferred model is FE. population, the analysis was focused on the number
1
If Prob > Chi2 is more than 0.05, H can be accepted, of people aged over 65, as this age group is the most
0
and the preferred model is RE. vulnerable to COVID-19. GDPpc represents the level of
wealth of the importing country valued at market prices;
3.2. Data and sample again, the value corresponding to 2020 has been estimated
The sample used in the study comprised 324 following the predictions by the European Central Bank.
observations reported by 27 reporters from the EU-27 and As the function in question is an import function, it should
Table 1. Main statistics for the period 2015 – 2020
Mean Max Min S.D.
Dependent variables: imports (100 kg)
Medical consumables 994,662 7,852,124 2179 1,476,134
Disinfectants 935,176 14,008,922 529 1,916,699
Protective garments 823,477 5,282,810 11,937 1,023,156
Medical devices 285,353 2,447,977 6757 378,933
Vehicles 127,136 1,455,688 2298 201,364
Oxygen therapy equipment 48,700 535,675 21 92,095
Test kits 47,186 892,633 169 84,692
Independent variables
GDPpc (Euros per capita) 29,230 102,200 6370 19,420
Beds (per hundred thousand inhabitants) 499 813 200 168
Population of people aged over 65 (persons) 3,268,921 18,090,682 79,805 4,543,532
HICP (annual rate of change) 1.4 7.1 −8.4 1.8
Abbreviations: GDPpc: Gross domestic product per capita; HICP: Harmonized Index of Consumer Price for Health; S.D.: Standard deviation.
Volume 1 Issue 2 (2023) 6 https://doi.org/10.36922/ghes.1207