
Page 129 - GHES-2-1
P. 129
Global Health Econ Sustain Prolonged impact of health-care expenditure on poverty
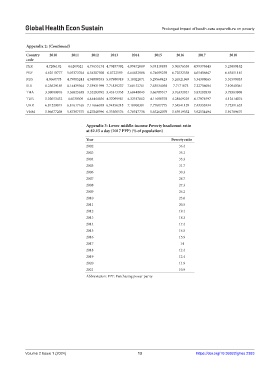
Appendix 2: (Continued)
Country 2010 2011 2012 2013 2014 2015 2016 2017 2018
code
PER 4.7206192 4.6209321 4.75655174 4.70197392 4.99472809 5.03110838 5.06576538 4.99378443 5.23800182
PRY 4.62510777 5.05373764 6.54307508 6.0722599 6.64632988 6.74699259 6.72532558 6.65456867 6.65451145
RUS 4.9660778 4.79005241 4.94080353 5.07980919 5.18022871 5.29560423 5.26521969 5.34388065 5.31590033
SLV 8.23629189 8.14439964 7.53931999 7.71839237 7.68152761 7.63034058 7.7171073 7.22756004 7.10940361
THA 3.39009976 3.56825638 3.52293992 3.45313358 3.68448043 3.66789317 3.76332021 3.83202839 3.79303908
TUR 5.02053452 4.6530509 4.44444656 4.37099981 4.32517862 4.11690378 4.28469229 4.17974997 4.12414074
UKR 6.81229019 6.81617165 7.11666059 6.94156218 7.18960381 7.77607775 7.54541159 7.43332434 7.72391653
VNM 5.96677208 5.87397575 6.27840996 6.33500576 5.78317738 5.65262079 5.65919352 5.92534494 5.91789675
Appendix 3: Lower middle‑income Poverty headcount ratio
at $2.15 a day (2017 PPP) (% of population)
Year Poverty ratio
2002 36.4
2003 35.1
2004 33.3
2005 31.7
2006 30.3
2007 28.7
2008 27.3
2009 26.2
2010 23.6
2011 20.5
2012 19.1
2013 18.3
2014 17.4
2015 16.5
2016 15.9
2017 14
2018 12.4
2019 12.4
2020 11.9
2021 10.9
Abbreviation: PPP: Purchasing power parity
Volume 2 Issue 1 (2024) 13 https://doi.org/10.36922/ghes.2383