
Page 127 - GHES-2-3
P. 127
Global Health Economics and
Sustainability
Positive and negative aspects of caregiving
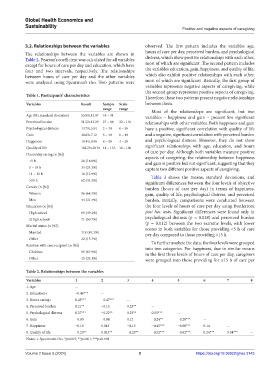
3.2. Relationships between the variables observed. The first pattern includes the variables age,
The relationships between the variables are shown in hours of care per day, perceived burden, and psychological
Table 2. Pearson’s coefficient was calculated for all variables distress, which show positive relationships with each other,
except for hours of care per day and education, which have most of which are significant. The second pattern includes
four and two intervals, respectively. The relationships the variables education, gain, happiness, and quality of life,
between hours of care per day and the other variables which also exhibit positive relationships with each other,
were analyzed using Spearman’s rho. Two patterns were most of which are significant. Basically, the first group of
variables represents negative aspects of caregiving, while
the second group represents positive aspects of caregiving.
Table 1. Participants’ characteristics Therefore, these two patterns present negative relationships
Variables Result Sample Scale between them.
range range Most of the relationships are significant, but two
Age (M±standard deviation) 55.89±12.07 18 – 91 variables – happiness and gain – present few significant
Perceived burden 51.52±12.29 27 – 86 22 – 110 relationships with other variables. Both happiness and gain
Psychological distress 14.79±5.54 2 – 30 0 – 36 have a positive, significant correlation with quality of life
Gain 30.63±7.12 5 – 40 0 – 40 and a negative, significant correlation with perceived burden
Happiness 19.44±4.96 8 – 28 4 – 28 and psychological distress. However, they do not show
Quality of life 105.29±20.54 44 – 153 16 – 160 significant relationships with age, education, and hours
Hours/day caring (n [%]) of care per day. Although both variables measure positive
aspects of caregiving, the relationship between happiness
<5 h 26 (18.6%) and gain is positive but not significant, suggesting that they
5 – 10 h 34 (24.3%) capture two different positive aspects of caregiving.
11 – 15 h 18 (12.9%) Table 3 shows the means, standard deviations, and
>15 h 62 (44.3%) significant differences between the four levels of objective
Gender (n [%]) burden (hours of care per day) in terms of happiness,
Women 96 (68.4%) gain, quality of life, psychological distress, and perceived
Men 44 (31.4%) burden. Initially, comparisons were conducted between
Education (n [%]) the four levels of hours of care per day using Bonferroni
High school 69 (49.3%) post hoc tests. Significant differences were found only in
psychological distress (p = 0.038) and perceived burden
≥High school 71 (50.7%)
Marital status (n [%]) (p = 0.012) between the two extreme levels, with lower
scores in both variables for those providing <5 h of care
Married 118 (84.3%) per day compared to those providing >15 h.
Other 22 (15.7%)
To further analyze the data, the four levels were grouped
Relation with care recipient (n [%]) into two categories. For happiness, due to similar means
Children 95 (67.9%) in the first three levels of hours of care per day, caregivers
Other 45 (32.1%) were grouped into those providing for ≤15 h of care per
Table 2. Relationships between the variables
Variables 1 2 3 4 5 6 7 8
1. Age --
2. Education+ −0.46*** --
3. Hours caring+ 0.45*** −0.47*** --
4. Perceived burden 0.21** −0.15 0.25** --
5. Psychological distress 0.27*** −0.22** 0.23** 0.55*** --
6. Gain −0.05 −0.04 0.12 −0.24** −0.28*** --
7. Happiness −0.16 0.012 −0.15 −0.45*** −0.60*** 0.14 --
8. Quality of life −0.23** 0.023** −0.23** −0.52*** −0.62*** 0.24*** 0.54*** --
Notes: + Spearman’s rho; *p≤0.05; **p≤0.01; ***p≤0.001
Volume 2 Issue 3 (2024) 5 https://doi.org/10.36922/ghes.3145