
Page 129 - GHES-2-3
P. 129
Global Health Economics and
Sustainability
Positive and negative aspects of caregiving
3.3. Hierarchical multiple regression 4. Discussion
Table 6 presents the results of the hierarchical multiple The description of the sample characteristics showed
regression analysis with psychological distress as the that family caregivers of PWAD present both negative
dependent variable. The analysis revealed that the coefficient
of determination (R ) significantly differed from zero at Table 4. Happiness, gain, quality of life, and psychological
2
the end of each step, indicating a significant relationship distress in perceived burden levels
between the predictor variables and the dependent variable. Perceived n Happiness Gain Quality of Psychological
In the first step, where age, gender, and education were burden life distress
included in the equation, R = 0.13 (p < 0.001). The change in M (SD) M (SD) M (SD) M (SD)
2
R from Model 1 to Model 2 (R = 0.36, change in R = 0.23,
2
2
2
p < 0.001) underscores the relevance of perceived burden No burden 0 - - - -
in the prediction of psychological distress. The inclusion of Mild 32 21.84 (4.12) 32.41 (5.76) 122.00 (17.93) 10.63 (4.01)
positive aspects of caregiving, such as happiness, gain, and Moderate 76 19.79 (4.84) 31.24 (7.12) 103.40 (17.60) 14.88 (5.24)
quality of life, in Model 3 further increased R (R = 0.56, Severe 32 16.19 (4.41) 27.41 (7.52) 93.09 (19.27) 18.75 (5.56)
2
2
change in R = 0.20, p < 0.001). Notes: Significant differences: (i) Happiness: mild > moderate***;
2
The beta values in Model 3, which includes all moderate > severe***. (ii) Gain: mild > moderate*; moderate > severe*.
(iii) Quality of life: mild > moderate***; mild > severe***; moderate
independent variables in the equation, demonstrate that > severe*. (iv) Psychological distress: Severe > moderate***; severe >
happiness and quality of life are the strongest predictors of mild***; moderate > mild ***. *p≤0.05; **p≤0.01; ***p≤0.001.
psychological distress. Perceived burden is the third most Abbreviation: SD: Standard deviation.
significant predictor, followed by gain. The adjusted R of
2
0.53 indicates that 53% of the variability in psychological Table 5. Happiness, gain, quality of life, and perceived
distress can be explained by higher levels of happiness, burden in psychological distress levels
quality of life, and gain, and lower levels of perceived burden. Low (n=69) High (n=71) t P
M (SD) M (SD)
Happiness 21.87 (4.22) 17.07 (4.48) 6.53 <0.001***
Gain 32.36 (5.72) 28.94 (7.94) 2.93 0.004**
Quality of life 116.18 (18.69) 94.68 (16.34) 7.27 <0.001***
Perceived burden 44.04 (9.76) 58.79 (9.93) −8.86 <0.001***
Notes: *p≤0.05; **p≤0.01; ***p≤0.001.
Table 6. Hierarchical multiple regression for psychological
distress as the dependent variable
Model 1 Model 2 Model 3
β t‑value β t‑value β t‑value
Age 0.25 2.15** 0.15 1.79 0.09 1.23
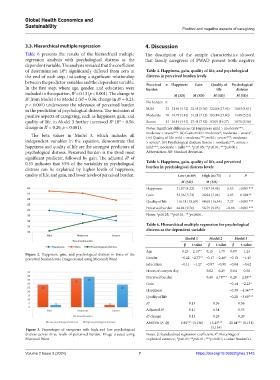
Figure 2. Happiness, gain, and psychological distress in three of the
perceived burden levels. Image created using Microsoft Word Gender −0.22 −2.77** −0.17 −2.46* −0.10 −1.45
Education −0.11 −1.27 −0.07 −0.90 −0.04 −0.62
Hours of care per day 0.02 0.29 0.04 0.50
Perceived burden 0.49 6.78*** 0.20 2.83**
Gain −0.14 −2.23*
Happiness −0.30 −4.36***
Quality of life −0.28 −3.60***
R 2 0.13 0.36 0.56
Adjusted R 2 0.11 0.34 0.53
2
R change 0.13 0.23 0.20
ANOVA (F, df) 6.92*** (3,136) 15.23*** 20.64*** (8,131)
(5,134)
Figure 3. Percentages of caregivers with high and low psychological
distress across three levels of perceived burden. Image created using Notes: β: Standardized regression coefficient; R : Percentage of
2
Microsoft Word explained variance.; *p≤0.05; **p≤0.01; ***p<0.001; t-value: Student’s t.
Volume 2 Issue 3 (2024) 7 https://doi.org/10.36922/ghes.3145