
Page 128 - GHES-2-3
P. 128
Global Health Economics and
Sustainability
Positive and negative aspects of caregiving
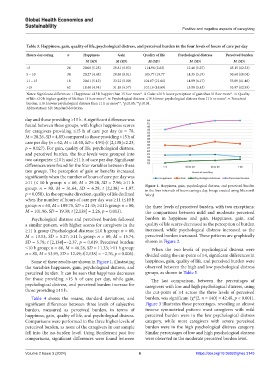
Table 3. Happiness, gain, quality of life, psychological distress, and perceived burden in the four levels of hours of care per day
Hours day caring n Happiness Gain Quality of life Psychological distress Perceived burden
M (SD) M (SD) M (SD) M (SD) M (SD)
<5 26 20.00 (5.28) 29.81 (6.83) 114.96 (2.82) 12.46 (5.27) 45.15 (12.33)
5 – 10 34 20.27 (4.48) 28.88 (8.81) 105.77 (19.77 14.35 (5.19) 50,68 (10.04)
11 – 15 18 20.61 (5.12) 33.22 (5.00) 104.67 (21.61) 14.89 (6.17) 53.89 (11.46)
>15 62 18.40 (4.94) 31.18 (6.57) 101.16 (18.69) 15.98 (5.43) 53.97 (12.93)
Notes: Significant differences: i. Happiness: ≤15 h happier than 15 h or more*. ii. Gain: ≤10 h lower perception of gain than 11 h or more*. iii. Quality
of life: ≤10 h higher quality of life than 11 h or more*. iv. Psychological distress: ≤10 h lower psychological distress than 11 h or more*. v. Perceived
burden: ≤10 h lower psychological distress than 11 h or more**. *p≤0.05; **p≤0.01.
Abbreviation: SD: Standard deviation.
day and those providing >15 h. A significant difference was
found between these groups, with higher happiness scores
for caregivers providing ≤15 h of care per day (n = 78,
M = 20.26, SD = 4.85) compared to those providing >15 h of
care per day (n = 62, M = 18.40, SD = 4.94) (t [2,138]=2.23,
p = 0.027). For gain, quality of life, psychological distress,
and perceived burden, the four levels were grouped into
two categories: ≤10 h and ≥11 h of care per day. Significant
differences were found for the four variables between these
two groups. The perception of gain or benefits increased
significantly when the number of hours of care per day was
≥11 (≤ 10 h group: n = 60, M = 29.28, SD = 7.96; ≥11 h
group: n = 80, M = 31.64, SD = 6.28; t [2,138] = 1.97, Figure 1. Happiness, gain, psychological distress, and perceived burden
in the four intervals of hours caring a day. Image created using Microsoft
p = 0.050). In the opposite direction, quality of life declined Word
when the number of hours of care per day was ≥11 (≤10 h
group: n = 60, M = 109.75, SD = 21.45; ≥11 h group: n = 80, the three levels of perceived burden, with two exceptions:
M = 101.96, SD = 19.30; t [2,138] = 2.26, p = 0.013). the comparisons between mild and moderate perceived
Psychological distress and perceived burden followed burden in happiness and gain. Happiness, gain, and
a similar pattern, with higher scores for caregivers in the quality of life scores decreased as the perception of burden
≥11 h group (Psychological distress: ≤10 h group: n = 60, increased, while psychological distress increased as the
M = 13.53, SD = 5.27; ≥11 h group: n = 80, M = 15.74, perceived burden increased. These patterns are graphically
SD = 5.78; t [2,138]=−2.37, p = 0.019. Perceived burden: shown in Figure 2.
≤10 h group: n = 60, M = 48.28, SD = 11.33; ≥11 h group: When the two levels of psychological distress were
n = 80, M = 53.95, SD = 12.49; t[2,138] = −2.76, p = 0.006). divided using the cut-point of ≥4, significant differences in
Some of these results are shown in Figure 1, illustrating happiness, gain, quality of life, and perceived burden were
the variables happiness, gain, psychological distress, and observed between the high and low psychological distress
perceived burden. It can be seen that happiness decreases groups, as shown in Table 5.
for those providing >15 h of care per day, while gain, The last comparison, between the percentages of
psychological distress, and perceived burden increase for caregivers with low and high psychological distress, using
those providing ≥11 h. the cut-point of ≥4 across the three levels of perceived
Table 4 shows the means, standard deviations, and burden, was significant (χ [2, n = 140] = 42.48, p < 0.001).
2
significant differences between three levels of subjective Figure 3 illustrates these percentages, revealing an almost
burden, measured as perceived burden, in terms of inverse symmetrical pattern: most caregivers with mild
happiness, gain, quality of life, and psychological distress. perceived burden were in the low psychological distress
Comparisons were performed in the three higher levels of category, while most caregivers with severe perceived
perceived burden, as none of the caregivers in our sample burden were in the high psychological distress category.
fell into the no-burden level. Using Bonferroni post hoc Similar percentages of low and high psychological distress
comparisons, significant differences were found between were observed in the moderate perceived burden level.
Volume 2 Issue 3 (2024) 6 https://doi.org/10.36922/ghes.3145