
Page 125 - GHES-2-4
P. 125
Global Health Economics and
Sustainability
Fiscal policy shocks and health outcomes
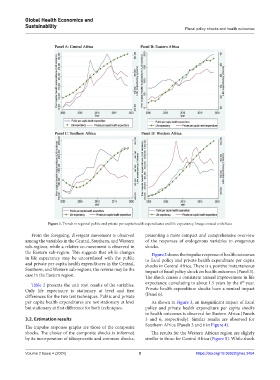
Figure 1. Trends in regional public and private per capita health expenditures and life expectancy. Image created with Stata
From the foregoing, divergent movement is observed presenting a more compact and comprehensive overview
among the variables in the Central, Southern, and Western of the responses of endogenous variables to exogenous
sub-regions, while a relative co-movement is observed in shocks.
the Eastern sub-region. This suggests that while changes Figure 2 shows the impulse response of health outcomes
in life expectancy may be uncorrelated with the public to fiscal policy and private health expenditure per capita
and private per capita health expenditures in the Central, shocks in Central Africa. There is a positive instantaneous
Southern, and Western sub-regions, the reverse may be the impact of fiscal policy shock on health outcomes (Panel 3).
case in the Eastern region. The shock causes a consistent annual improvement in life
th
Table 2 presents the unit root results of the variables. expectancy, cumulating to about 1.5 years by the 8 year.
Only life expectancy is stationary at level and first Private health expenditure shocks have a neutral impact
differences for the two test techniques. Public and private (Panel 6).
per capita health expenditures are not stationary at level As shown in Figure 3, an insignificant impact of fiscal
but stationary at first difference for both techniques. policy and private health expenditure per capita shocks
to health outcomes is observed for Eastern Africa (Panels
3.2. Estimation results 3 and 6, respectively). Similar results are observed for
The impulse response graphs are those of the composite Southern Africa (Panels 3 and 6 in Figure 4).
shocks. The choice of the composite shocks is informed The results for the Western African region are slightly
by its incorporation of idiosyncratic and common shocks, similar to those for Central Africa (Figure 5). While shock
Volume 2 Issue 4 (2024) 5 https://doi.org/10.36922/ghes.3454