
Page 69 - GHES-2-4
P. 69
Global Health Economics and
Sustainability
Assessing Vietnam’s pandemic lockdown
days since the date on which intervention j occurred. In “effect size” (Harrer et al., 2021). Given that some degree of
Equation II, the β coefficient represents the difference in between-study heterogeneity is almost always expected, it
zj
the slope due to intervention j compared to the slope due is common practice in many fields, including medicine and
to intervention (j – 1). the social sciences, to use a random-effects model (Harrer
For illustration, Table 3 describes the dataset used in et al., 2021). Therefore, to adhere to this common practice,
the ITS model for Dong Thap province, which had two we employed a random-effects meta-analysis to aggregate
interventions on July 11, 2021, and July 19, 2021. the results and analyze comparative efficacy based on
several factors (e.g., government directive, region).
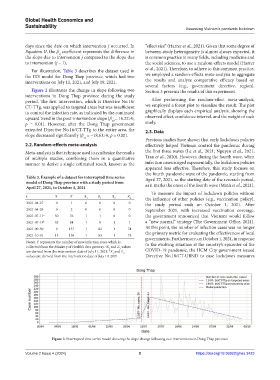
Figure 2 illustrates the change in slope following two Section 3 presents the results of this experiment.
interventions in Dong Thap province during the study
period. The first intervention, which is Directive No.16/ After performing the random-effect meta-analysis,
CT-TTg, was applied to targeted areas but was insufficient we employed a forest plot to visualize the result. The plot
to control the infection rate, as indicated by the continued graphically displays each empirical analysis, showing the
upward trend in the post-intervention slope (β = 16.22>0, observed effect, confidence interval, and the weight of each
z0
p = 0.01). However, after the Dong Thap government study.
extended Directive No.16/CT-TTg to the entire area, the 2.3. Data
slope decreased significantly (β = −18.63>0, p = 0.00).
z1
Previous studies have shown that early lockdown policies
2.2. Random-effects meta-analysis effectively helped Vietnam control the pandemic during
Meta-analysis is the technique used to synthesize the results the first three waves (Le et al., 2021; Nguyen et al., 2021;
of multiple studies, combining them in a quantitative Tran et al., 2020). However, during the fourth wave, when
manner to derive a single estimated result, known as the infection cases surged exponentially, the lockdown policies
appeared less effective. Therefore, this study focuses on
the fourth pandemic wave of the pandemic, starting from
Table 3. Example of a dataset for interrupted time series April 27, 2021, as the starting date of the research period,
model of Dong Thap province with a study period from
April 27, 2021, to October 1, 2021 as it marks the onset of the fourth wave (Minh et al., 2021).
To measure the impact of lockdown policies without
t Y T X Z X Z
1 1 2 2 the influence of other policies (e.g., vaccination policy),
2021-04-27 0 1 0 0 0 0 the study period ends on October 1, 2021. After
2021-04-28 0 2 0 0 0 0 September 2021, with increased vaccination coverage,
2021-07-11 a 50 76 1 1 0 0 the government announced that Vietnam would follow
2021-07-19 b 53 84 1 9 1 1 a “new normal” strategy (The Government Office, 2021).
2021-09-30 9 157 1 82 1 74 At this point, the number of infection cases was no longer
2021-10-01 13 158 1 83 1 75 the primary metric for evaluating the effectiveness of local
governments. Furthermore, on October 1, 2021, in response
Notes: Y represents the number of new infection cases which is to the evolving situation at the country’s epicenter of the
collected from the Ministry of Health’s data gateway. X and Z values
a
1
1
are derived from the intervention date of July 11, 2021. X and Z 2 COVID-19 pandemic, the HCM City government issued
b
2
values are derived from the intervention date of July 19, 2021 Directive No.18/CT-UBND to ease lockdown measures
Figure 2. Interrupted time series model showing the slope change following two interventions in Dong Thap province
Volume 2 Issue 4 (2024) 5 https://doi.org/10.36922/ghes.3423