
Page 73 - GHES-2-4
P. 73
Global Health Economics and
Sustainability
Assessing Vietnam’s pandemic lockdown
of cases continued to increase daily even after Directive 3.2.1. Comparative analysis based on geographical
No.16/CT-TTg was applied, reaching a peak of 345 cases locations
on September 5, 2021, with an average daily increase of Table 4 presents the meta-analysis results of interventions
0.64 cases. grouped by their region. Except for the Southeast area,
It is worth noting that when Directive No.16/CT-TTg which was the epicenter of the fourth pandemic wave,
was implemented in these provinces, the number of all other regions exhibited negative pooled effect results.
new infections was still relatively low compared to other This finding indicates that the policy interventions were
South-east provinces. Therefore, it cannot be concluded generally effective in these regions.
that the local governments were slow in executing the Figure 7 illustrates the meta-analysis results for the
interventions, as seen in Binh Duong or Dong Nai. South-east region. Despite the strictest directive (Directive
However, the testing efforts were ineffective, as infections No.16/CT-TTg) being implemented across all cities and
were not detected promptly, allowing the virus to spread provinces in this region, most policy interventions were
within the population. ineffective, as indicated by positive post-intervention slope
3.2. Discussion on policy implementation change values. Notable exceptions were Directive No.11/
effectiveness CT-UBND in HCM City (intervention code HCM-CT11-1)
and Directive No.16/CT-TTg applied in Tay Ninh province
This study focused on the coefficient representing the post- (intervention code TayNinh-CT16-2), both of which had
intervention slope change value to analyze the effectiveness significant effects. The post-intervention slope change
of policy interventions. The results of these coefficients was −59.14 (95% CI: −86.7 – −31.58) for HCM-CT11-1
were synthesized and classified into different groups. In and -9.98 (95% CI: −55.18 – 12.34) for TayNinh-CT16-2.
Section 3, the first subsection analyzes the results based on
geography, while the second subsection groups the results In contrast to the South-east, the Northern Midlands
based on policy characteristics. and Mountains areas and the Central Highlands provinces
managed to keep the pandemic under control, as indicated
Table 4. Meta‑analysis results: Policy interventions based on by pooled effect results of −0.1 (95% CI: −0.74 – 0.54) and
2
their region −0.15 (95% CI: −0.55 – 0.25), respectively. A common
characteristic of these provinces is their sparse population
Region Pooled effect 95% confidence I (%) density, which hinders the spread of the virus and makes it
2
result interval easier for authorities to implement containment measures.
Northern Midlands −0.1 −0.74 – 0.54 85 Therefore, local administrations in these provinces only
and Mountain needed to apply Directive No.16/CT-TTg to targeted areas
Red river delta −0.02 −0.32 – 0.28 87 to control the pandemic effectively.
North-central and −0.25 −0.99 – 0.49 87 The situation in the Red River Delta and North-Central
central coastline
Central highlands −0.15 −0.55 – 0.25 62 and Central Coastline was similar to that of the Northern
Midlands and Mountains areas and the Central Highlands
Southeast 0.36 −11.62 – 12.34 86
Mekong river delta −0.11 −0.56 – 0.34 50% 2 The results are not reported here to conserve space but
Source: Authors’ work available upon request.
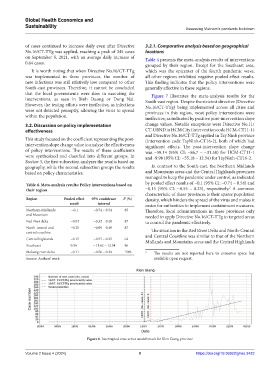
Figure 6. Interrupted time series model result for Kien Giang province
Volume 2 Issue 4 (2024) 9 https://doi.org/10.36922/ghes.3423