
Page 75 - GHES-2-4
P. 75
Global Health Economics and
Sustainability
Assessing Vietnam’s pandemic lockdown
was not as high as in other regions. As discussed in the Directives No.15/CT-TTg and No.16/CT-TTg were
previous section, this result could be attributed to limited particularly effective tools in flattening the curve and
testing capacity, which hindered the timely detection of reversing the trend during the post-intervention period.
the disease, allowing the virus to spread throughout the Their pooled effect results were −0.11 (95% CI: −0.25 – 0.03)
community. and −0.26 (95% CI: −0.81 – 0.26), respectively.
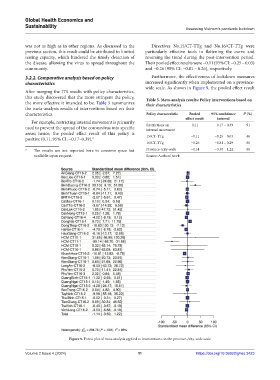
3.2.2. Comparative analysis based on policy Furthermore, the effectiveness of lockdown measures
characteristics increased significantly when implemented on a province-
wide scale. As shown in Figure 9, the pooled effect result
After merging the ITS results with policy characteristics,
this study discovered that the more stringent the policy, Table 5. Meta‑analysis results: Policy interventions based on
the more effective it intended to be. Table 5 summarizes their characteristics
the meta-analysis results of interventions based on their
characteristics. Policy characteristic Pooled 95% confidence I (%)
2
effect result interval
For example, restricting internal movement is primarily
used to prevent the spread of the coronavirus into specific Restrictions on 0.11 −0.17 – 0.39 91
internal movement
areas; hence, the pooled effect result of this policy is 15/CT-TTg −0.11 −0.25 – 0.03 40
positive (0.11, 95% CI: −0.17–0.39). 3
16/CT-TTg −0.26 −0.81 – 0.29 86
3 The results are not reported here to conserve space but Province-/city-wide −1.14 −3.50 – 1.22 88
available upon request. Source: Authors’ work
Figure 9. Forest plot of meta-analysis applied to interventions on the province-/city-wide scale
Volume 2 Issue 4 (2024) 11 https://doi.org/10.36922/ghes.3423