
Page 145 - GHES-3-1
P. 145
Global Health Economics and
Sustainability
Reducing public stigma related to psychosis
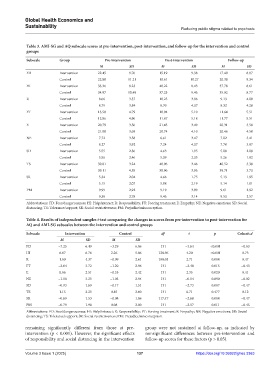
Table 3. AMI‑SG and AQ subscale scores at pre‑intervention, post‑intervention, and follow‑up for the intervention and control
groups
Subscale Group Pre‑intervention Post‑intervention Follow‑up
M SD M SD M SD
FD Intervention 22.45 9.76 15.19 9.38 17.49 8.87
Control 22.89 11.21 19.61 10.27 20.38 9.34
HI Intervention 33.36 8.23 40.22 8.43 37.78 8.61
Control 34.97 10.49 37.23 9.46 35.02 8.77
R Intervention 8.66 3.37 10.25 3.96 9.13 4.00
Control 8.79 3.84 8.70 4.37 8.32 4.28
FT Intervention 13.58 4.79 10.94 5.10 11.64 5.51
Control 12.86 4.96 11.67 5.18 11.77 5.51
E Intervention 20.79 3.56 21.45 3.49 20.31 3.58
Control 21.09 3.69 20.74 4.10 20.46 4.50
NE Intervention 7.72 3.58 6.61 3.47 7.02 3.41
Control 8.27 3.92 7.24 4.37 7.70 3.97
SD Intervention 5.55 2.36 4.63 1.95 5.08 2.08
Control 5.56 2.46 5.39 2.33 5.26 1.92
TS Intervention 39.81 3.24 40.96 3.46 40.52 3.38
Control 39.11 4.55 39.96 3.96 39.71 3.73
SR Intervention 5.34 2.04 4.66 1.75 5.13 1.95
Control 5.15 2.07 5.08 2.19 5.14 1.81
PM Intervention 9.99 2.92 9.19 3.09 9.61 2.92
Control 9.38 2.78 9.46 3.14 9.53 2.57
Abbreviations: FD: Fear/dangerousness; HI: Help/interact; R: Responsibility; FT: Forcing treatment; E: Empathy; NE: Negative emotions; SD: Social
distancing; TS: Tolerance/support; SR: Social restrictiveness; PM: Prejudice/misconception.
Table 4. Results of independent samples t‑test comparing the changes in scores from pre‑intervention to post‑intervention for
AQ and AMI‑SG subscales between the intervention and control groups
Subscale Intervention Control df t p Cohen’s d
M SD M SD
FD −7.25 6.49 −3.29 6.06 131 −3.64 <0.001 −0.63
HI 6.87 6.76 2.26 5.86 128.96 4.20 <0.001 0.73
R 1.60 4.37 −0.09 2.61 108.03 2.71 0.008 0.47
FT −2.64 3.72 −1.20 2.96 131 −2.48 0.015 −0.43
E 0.66 2.51 −0.35 2.42 131 2.35 0.020 0.41
NE −1.10 3.25 −1.03 2.94 131 −0.14 0.890 −0.02
SD −0.93 1.69 −0.17 1.51 131 −2.73 0.007 −0.47
TS 1.15 2.25 0.85 2.60 131 0.71 0.477 0.12
SR −0.69 1.53 −0.08 1.06 117.47 −2.68 0.008 −0.47
PM −0.79 1.90 0.08 2.00 131 −2.57 0.011 −0.45
Abbreviations: FD: Fear/dangerousness; HI: Help/interact; R: Responsibility; FT: Forcing treatment; E: Empathy; NE: Negative emotions; SD: Social
distancing; TS: Tolerance/support; SR: Social restrictiveness; PM: Prejudice/misconception.
remaining significantly different from those at pre- group were not sustained at follow-up, as indicated by
intervention (p < 0.001). However, the significant effects nonsignificant differences between pre-intervention and
of responsibility and social distancing in the intervention follow-up scores for these factors (p > 0.05).
Volume 3 Issue 1 (2025) 137 https://doi.org/10.36922/ghes.3363