
Page 214 - GHES-3-2
P. 214
Global Health Economics and
Sustainability
Health behaviors during COVID-19 pandemic
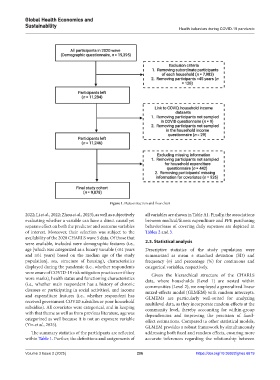
Figure 1. Data extraction and flow chart
2022; Li et al., 2022; Zhou et al., 2023), as well as subjectively all variables are shown in Table A1. Finally, the associations
evaluating whether a variable can have a direct causal yet between medical/fitness expenditure and PPE purchasing
separate effect on both the predictor and outcome variables behavior/ease of covering daily expenses are depicted in
of interest. Moreover, their selection was subject to the Tables 2 and 3.
availability of the 2020 CHARLS wave 5 data. Of those that
were available, included were demographic features (i.e., 2.3. Statistical analysis
age [which was categorized as a binary variable (<61 years Descriptive statistics of the study population were
and ≥61 years) based on the median age of the study summarized as mean ± standard deviation (SD) and
population], sex, structure of housing), characteristics frequency (n) and percentage (%) for continuous and
displayed during the pandemic (i.e., whether respondents categorical variables, respectively.
were aware of COVID-19 risk mitigation practices or if they Given the hierarchical structure of the CHARLS
wore masks), health status and functioning characteristics data, where households (Level 1) are nested within
(i.e., whether main respondent has a history of chronic communities (Level 2), we employed a generalized linear
diseases or participating in social activities), and income mixed-effects model (GLMEM) with random intercepts.
and expenditure features (i.e., whether respondent has GLMEMs are particularly well-suited for analyzing
received government COVID subsidies or poor household multilevel data, as they incorporate random effects at the
subsidies). All covariates were categorical, and in keeping community level, thereby accounting for within-group
with that theme as well as from previous literature, age was dependencies and improving the precision of fixed-
categorized as well because it is not an exposure variable effect estimations. Compared to other statistical models,
(Yin et al., 2025). GLMEM provides a robust framework by simultaneously
The summary statistics of the participants are reflected addressing both fixed and random effects, ensuring more
within Table 1. Further, the definitions and assignments of accurate inferences regarding the relationship between
Volume 3 Issue 2 (2025) 206 https://doi.org/10.36922/ghes.6619