
Page 216 - GHES-3-2
P. 216
Global Health Economics and
Sustainability
Health behaviors during COVID-19 pandemic
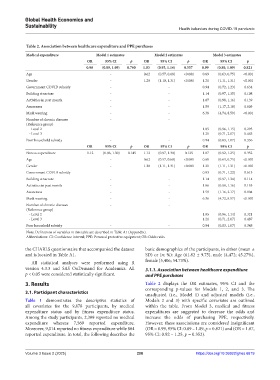
Table 2. Association between healthcare expenditure and PPE purchases
Medical expenditure Model 1 estimates Model 2 estimates Model 3 estimates
OR 95% CI p OR 95% CI p OR 95% CI p
0.98 (0.89, 1.09) 0.760 1.03 (0.93, 1.14) 0.557 0.99 (0.89, 1.09) 0.821
Age - 0.62 (0.57, 0.68) <0.001 0.69 (0.63, 0.75) <0.001
Gender - 1.20 (1.10, 1.31) <0.001 1.21 (1.11, 1.31) <0.001
Government COVID subsidy - - 0.94 (0.72, 1.23) 0.634
Building structure - - 1.14 (0.97, 1.35) 0.108
Activities in past month - - 1.07 (0.98, 1.16) 0.139
Awareness - - 1.59 (1.17, 2.18) 0.003
Mask wearing - - 6.38 (4.74, 8.59) <0.001
Number of chronic diseases - -
(Reference group)
- Level 2 1.05 (0.96, 1.15) 0.295
- Level 3 1.21 (0.71, 2.07) 0.483
Poor household subsidy - - 0.94 (0.83, 1.07) 0.336
OR 95% CI p OR 95% CI p OR 95% CI p
Fitness expenditure 1.12 (0.96, 1.30) 0.145 1.12 (0.97, 1.30) 0.125 1.07 (0.92, 1.25) 0.352
Age - 0.62 (0.57, 0.68) <0.001 0.68 (0.63, 0.75) <0.001
Gender - 1.20 (1.11, 1.31) <0.001 1.21 (1.11, 1.31) <0.001
Government COVID subsidy - - 0.93 (0.71, 1.22) 0.613
Building structure - - 1.14 (0.97, 1.34) 0.114
Activities in past month - - 1.06 (0.98, 1.16) 0.153
Awareness - - 1.59 (1.16, 2.17) 0.004
Mask wearing - - 6.36 (4.72, 8.57) <0.001
Number of chronic diseases - -
(Reference group)
- Level 2 1.05 (0.96, 1.14) 0.321
- Level 3 1.21 (0.71, 2.07) 0.487
Poor household subsidy - - 0.94 (0.83, 1.07) 0.345
Note: Definitions of variables in this table are described in Table A1 (Appendix).
Abbreviations: CI: Confidence interval; PPE: Personal protective equipment; OR: Odds ratio.
the CHARLS questionnaire that accompanied the dataset basic demographics of the participants, in either (mean ±
and is located in Table A1. SD) or (n; %): Age (61.82 ± 9.75), male (4,472; 45.27%),
All statistical analyses were performed using R female (5,406; 54.73%).
version 4.3.3 and SAS OnDemand for Academics. All 3.1.1. Association between healthcare expenditure
p < 0.05 were considered statistically significant. and PPE purchases
3. Results Table 2 displays the OR estimates, 95% CI and the
corresponding p-values for Models 1, 2, and 3. The
3.1. Participant characteristics unadjusted (i.e., Model 1) and adjusted models (i.e.,
Table 1 demonstrates the descriptive statistics of Models 2 and 3) with specific covariates are outlined
all covariates for the 9,878 participants, by medical within the table. From Model 3, medical and fitness
expenditure status and by fitness expenditure status. expenditures are suggested to decrease the odds and
Among the study participants, 2,309 reported no medical increase the odds of purchasing PPE, respectively.
expenditure whereas 7,569 reported expenditure. However, these associations are considered insignificant
Moreover, 9,014 reported no fitness expenditure while 864 (OR = 0.99, 95% CI: 0.89 – 1.09, p = 0.821) and (OR = 1.07,
reported expenditure. In total, the following describes the 95% CI: 0.92 – 1.25, p = 0.352).
Volume 3 Issue 2 (2025) 208 https://doi.org/10.36922/ghes.6619