
Page 215 - GHES-3-2
P. 215
Global Health Economics and
Sustainability
Health behaviors during COVID-19 pandemic
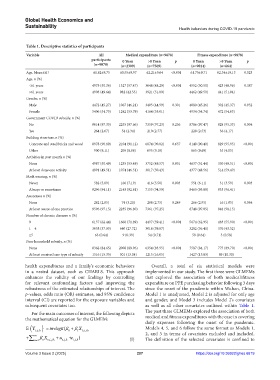
Table 1. Descriptive statistics of participants
Variable All Medical expenditure (n=9878) Fitness expenditure (n=9878)
participants 0 Yuan >0 Yuan p 0 Yuan >0 Yuan p
(n=9878) (n=2309) (n=7569) (n=9014) (n=864)
Age, Mean±SD 61.82±9.75 60.55±9.97 62.21±9.64 <0.001 61.75±9.71 62.54±10.13 0.023
Age, n (%)
<61 years 4975 (50.36) 1327 (57.47) 3648 (48.20) <0.001 4552 (50.50) 423 (48.96) 0.387
>61 years 4903 (49.64) 982 (42.53) 3921 (51.80) 4462 (49.50) 441 (51.04)
Gender, n (%)
Male 4472 (45.27) 1067 (46.21) 3405 (44.99) 0.301 4080 (45.26) 392 (45.37) 0.952
Female 5406 (54.73) 1242 (53.79) 4164 (55.01) 4934 (54.74) 472 (54.63)
Government COVID subsidy, n (%)
No 9614 (97.33) 2255 (97.66) 7359 (97.23) 0.256 8786 (97.47) 828 (95.33) 0.004
Yes 264 (2.67) 54 (2.34) 210 (2.77) 228 (2.53) 36 (4.17)
Building structure, n (%)
Concrete and steel/bricks and wood 8978 (90.89) 2104 (91.12) 6874 (90.82) 0.657 8149 (90.40) 829 (95.95) <0.001
Other 900 (9.11) 205 (8.88) 695 (9.18) 865 (9.60) 35 (4.05)
Activities in past month n (%)
None 4987 (50.49) 1235 (53.49) 3752 (49.57) 0.001 4637 (51.44) 350 (40.51) <0.001
At least done one activity 4891 (49.51) 1074 (46.51) 3817 (50.43) 4377 (48.56) 514 (59.49)
Mask wearing, n (%)
Never 582 (5.89) 166 (7.19) 416 (5.50) 0.003 551 (6.11) 31 (3.59) 0.003
Always or sometimes 9296 (94.11) 2143 (92.81) 7153 (94.50) 8463 (93.89) 833 (96.41)
Awareness n (%)
None 282 (2.85) 74 (3.20) 208 (2.75) 0.249 266 (2.95) 16 (1.85) 0.064
At least aware of one practice 9596 (97.15) 2235 (96.80) 7361 (97.25) 8748 (97.05) 848 (98.15)
Number of chronic diseases n (%)
0 6157 (62.44) 1660 (71.89) 4497 (59.41) <0.001 5674 (62.95) 483 (55.90) <0.001
1 – 4 3658 (37.03) 640 (27.72) 3018 (39.87) 3282 (36.41) 376 (43.52)
≥5 63 (0.64) 9 (0.39) 54 (0.71) 58 (0.64) 5 (0.58)
Poor household subsidy, n (%)
None 8362 (84.65) 2008 (89.96) 6354 (83.95) <0.001 7587 (84.17) 775 (89.70) <0.001
At least received one type of subsidy 1516 (15.35) 301 (13.04) 1215 (16.05) 1427 (15.83) 89 (10.30)
health expenditures and a family’s economic behaviors Overall, a total of six statistical models were
in a nested dataset, such as CHARLS. This approach implemented in our study. The first three were GLMEMs
enhances the validity of our findings by controlling that explored the association of both medical/fitness
for relevant confounding factors and improving the expenditure on PPE purchasing behavior following 3 days
robustness of the estimated relationships of interest. The since the onset of the pandemic within Wuhan, China.
p-values, odds ratio (OR) estimates, and 95% confidence Model 1 is unadjusted, Model 2 is adjusted for only age
interval (CI) are reported for the exposure variables and and gender, and Model 3 includes Model 2’s covariates
subsequent covariates too. as well as all other covariates outlined within Table 1.
For the main outcomes of interest, the following depicts The past three GLMEMs explored the association of both
the mathematical equation for the GLMEM: medical and fitness expenditures with the ease in covering
daily expenses following the onset of the pandemic.
(
E Y i, j, k ) invlogit= (β 0 β + 1 X 1, , ,i jk Models 4, 5, and 6 follow the same format as Models 1,
+ ∑ m 2 β n X n i , ,, jk + u o ,, jk e + i ,, jk ) (I) 2, and 3 in terms of covariates excluded and included.
The definition of the selected covariates is confined to
n=
Volume 3 Issue 2 (2025) 207 https://doi.org/10.36922/ghes.6619