
Page 217 - GHES-3-2
P. 217
Global Health Economics and
Sustainability
Health behaviors during COVID-19 pandemic
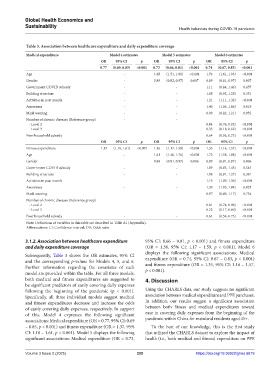
Table 3. Association between healthcare expenditure and daily expenditure coverage
Medical expenditure Model 4 estimates Model 5 estimates Model 6 estimates
OR 95% CI p OR 95% CI p OR 95% CI p
0.77 (0.69, 0.85) <0.001 0.73 (0.66, 0.81) <0.001 0.74 (0.67, 0.83) <0.001
Age - 1.65 (1.51, 1.80) <0.001 1.76 (1.61, 1.93) <0.001
Gender - 0.89 (0.82, 0.97) 0.007 0.89 (0.81, 0.97) 0.007
Government COVID subsidy - - 1.11 (0.84, 1.46) 0.457
Building structure - - 1.08 (0.92, 1.28) 0.351
Activities in past month - - 1.21 (1.11, 1.32) <0.001
Awareness - - 1.40 (1.06, 1.86) 0.019
Mask wearing - - 0.99 (0.82, 1.21) 0.952
Number of chronic diseases (Reference group) - -
- Level 2 0.84 (0.76, 0.92) <0.001
- Level 3 0.33 (0.18, 0.62) <0.001
Poor household subsidy - - 0.64 (0.56, 0.73) <0.001
OR 95% CI p OR 95% CI p OR 95% CI p
Fitness expenditure 1.37 (1.18, 1.61) <0.001 1.36 (1.17, 1.59) <0.001 1.35 (1.16, 1.57) <0.001
Age - 1.61 (1.48, 1.76) <0.001 1.72 (1.58, 1.88) <0.001
Gender - 0.89 (0.81, 0.97) 0.006 0.89 (0.81, 0.97) 0.006
Government COVID subsidy - - 1.09 (0.83, 1.43) 0.545
Building structure - - 1.08 (0.91, 1.27) 0.381
Activities in past month - - 1.19 (1.09, 1.30) <0.001
Awareness - - 1.39 (1.05, 1.84) 0.023
Mask wearing - - 0.97 (0.80, 1.17) 0.734
Number of chronic diseases (Reference group) - -
- Level 2 0.81 (0.74, 0.89) <0.001
- Level 3 0.32 (0.17, 0.60) <0.001
Poor household subsidy - - 0.64 (0.56, 0.73) <0.001
Note: Definitions of variables in this table are described in Table A1 (Appendix).
Abbreviations: CI: Confidence interval; OR: Odds ratio.
3.1.2. Association between healthcare expenditure 95% CI: 0.66 – 0.81, p < 0.001) and fitness expenditure
and daily expenditure coverage (OR = 1.36, 95% CI: 1.17 – 1.59, p < 0.001). Model 6
Subsequently, Table 3 shows the OR estimates, 95% CI displays the following significant associations: Medical
and the corresponding p-values for Models 4, 5, and 6. expenditure (OR = 0.74, 95% CI: 0.67 – 0.83, p < 0.001)
Further information regarding the covariates of each and fitness expenditure (OR = 1.35, 95% CI: 1.16 – 1.57,
model are provided within the table. For all three models, p < 0.001).
both medical and fitness expenditures are suggested to 4. Discussion
be significant predictors of easily covering daily expenses
following the beginning of the pandemic (p < 0.001). Using the CHARLS data, our study suggests no significant
Specifically, all three individual models suggest medical association between medical expenditure and PPE purchases.
and fitness expenditures decrease and increase the odds In addition, our results suggest a significant association
of easily covering daily expenses, respectively. In support between both fitness and medical expenditures toward
of this, Model 4 expresses the following significant ease in covering daily expenses from the beginning of the
associations: Medical expenditure (OR = 0.77, 95% CI: 0.69 pandemic within China for mainland residents aged 45+.
– 0.85, p < 0.001) and fitness expenditure (OR = 1.37, 95% To the best of our knowledge, this is the first study
CI: 1.18 – 1.61, p < 0.001). Model 5 displays the following that utilized the CHARLS dataset to explore the impact of
significant associations: Medical expenditure (OR = 0.73, health (i.e., both medical and fitness) expenditure on PPE
Volume 3 Issue 2 (2025) 209 https://doi.org/10.36922/ghes.6619