
Page 98 - GHES-3-2
P. 98
Global Health Economics and
Sustainability
Student anxiety/stress/depression
participants who recorded normal anxiety values were children and 19.1% of the women with children. Finally,
women and men aged 34 to 41 years who were also parents. 37.2% of the participants who presented normal stress
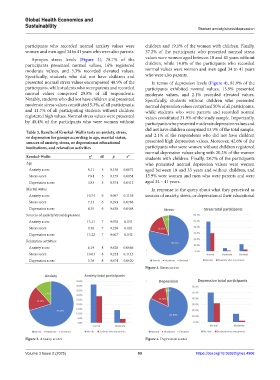
Apropos stress levels (Figure 3), 78.7% of the values were women aged between 18 and 41 years without
participants presented normal values, 16% registered children, while 14.8% of the participants who recorded
moderate values, and 5.3% recorded elevated values. normal values were women and men aged 34 to 41 years
Specifically, students who did not have children and who were also parents.
presented normal stress values encompassed 48.9% of the In terms of depression levels (Figure 4), 81.9% of the
participants, while students who were parents and recorded participants exhibited normal values, 15.9% presented
normal values comprised 29.8% of all respondents. moderate values, and 2.1% recorded elevated values.
Notably, students who did not have children and presented Specifically, students without children who presented
moderate stress values constituted 5.3%, of all participants, normal depression values comprised 50% of all participants,
and 11.7% of all participating students without children while students who were parents and recorded normal
registered high values. Normal stress values were presented values constituted 31.9% of the study sample. Importantly,
by 40.4% of the participants who were women without participants who presented moderate depression values and
did not have children comprised 13.9% of the total sample,
Table 3. Results of Kruskal–Wallis tests on anxiety, stress,
or depression for groups according to age, marital status, and 2.1% of the respondents who did not have children
sources of anxiety, stress, or depressionat educational presented high depression values. Moreover, 42.6% of the
institutions, and relaxation activities participants who were women without children registered
normal depression values along with 20.2% of the women
Kruskal–Wallis χ² df p ε² students with children. Finally, 28.7% of the participants
Age who presented normal depression values were women
Anxiety score 8.11 5 0.150 0.0872 aged between 18 and 33 years and without children, and
Stress score 7.94 5 0.159 0.0854 15.9% were women and men who were parents and were
Depression score 3.83 5 0.574 0.0412 aged 34 – 41 years.
Marital status In response to the query about what they perceived as
Anxiety score 10.74 6 0.097 0.1155 sources of anxiety, stress, or depression at their educational
Stress score 7.33 6 0.291 0.0788
Depression score 4.35 6 0.630 0.0468
Sources of anxiety/stress/depression
Anxiety score 13.11 7 0.070 0.141
Stress score 9.36 7 0.228 0.101
Depression score 13.22 7 0.067 0.142
Relaxation activities
Anxiety score 6.19 8 0.626 0.0666
Stress score 10.63 8 0.224 0.1143
Depression score 5.76 8 0.674 0.0620
Figure 3. Stress scores
Figure 2. Anxiety scores Figure 4. Depression scores
Volume 3 Issue 2 (2025) 90 https://doi.org/10.36922/ghes.4906