Page 218 - GHES-3-3
P. 218

Global Health Economics and
            Sustainability
                                                                       COVID-19 vaccination decisions and mandate impact


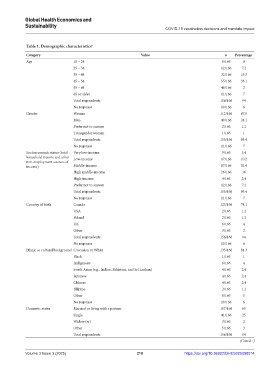
            Table 1. Demographic characteristics a
            Category                                         Value                               n   Percentage
            Age                 18 – 24                                                        0/166    0
                                25 – 34                                                        12/166   7.2
                                35 – 44                                                        32/166  19.3
                                45 – 54                                                        55/166  33.1
                                55 – 64                                                        46/166   2
                                65 or older                                                    11/166   7
                                Total respondents                                              156/166  94
                                No response                                                    10/166   6
            Gender              Woman                                                          112/166  67.5
                                Man                                                            40/166  24.1
                                Prefer not to answer                                           2/166    1.2
                                Transgender woman                                              1/166    1
                                Total respondents                                              155/166  93.4
                                No response                                                    11/166   7
            Socioeconomic status (total   Very low-income                                      9/166    5.4
            household income and other   Low-income                                            17/166  10.2
            non-employment sources of
            income)             Middle-income                                                  87/166  52.4
                                High middle-income                                             26/166   16
                                High-income                                                    4/166    2.4
                                Prefer not to answer                                           12/166   7.2
                                Total respondents                                              155/166  93.4
                                No response                                                    11/166   7
            Country of birth    Canada                                                         123/166  74.1
                                USA                                                            2/166    1.2
                                Poland                                                         2/166    1.2
                                UK                                                             6/166    4
                                Other                                                          3/166    2
                                Total respondents                                              156/166  94
                                No response                                                    10/166   6
            Ethnic or cultural background  Caucasian or White                                  135/166  81.3
                                Black                                                          1/166    1
                                Indigenous                                                     6/166    4
                                South Asian (e.g., Indian, Pakistani, and Sri Lankan)          4/166    2.4
                                Japanese                                                       4/166    2.4
                                Chinese                                                        4/166    2.4
                                Filipino                                                       2/166    1.2
                                Other                                                          8/166    5
                                No response                                                    10/166   6
            Domestic status     Married or living with a partner                               107/166  65
                                Single                                                         41/166   25
                                Widow (er)                                                     3/166    2
                                Other                                                          5/166    3
                                Total respondents                                              156/166  94
                                                                                                       (Cont’d...)

            Volume 3 Issue 3 (2025)                        210                 https://doi.org/10.36922/GHES025080014
   213   214   215   216   217   218   219   220   221   222   223