
Page 244 - GHES-3-3
P. 244
Global Health Economics and
Sustainability
Empirical resource allocation in healthcare
The macrostate of the economic system is defined by the maximizing “quasi-entropy.” “The distribution for which
distribution of specialists among objects. Each macrostate the number of implementation methods is the maximum
can arise from various microstate combinations, where a will be the most likely.” (Trubnikov & Trubnikova, 2004).
microstate represents an institution with a specific set of
specialists. Macrostates that differ only by permutations 3. Results
of identical specialists are considered equivalent. In To analyze the distribution of healthcare resources among
thermodynamics, the number of different microstates by countries using the law of distribution of competitors,
which a given macrostate can be realized is called statistical statistical datasets were compiled based on the following
weight. We adopted the terminology of thermodynamics indicators: the number of physicians, number of specialist
and determined the statistical weight of the object by the surgical workforce, number of hospital beds, and number
number of specialists contributing their human capital to of hospital beds per 100,000 population.
it. Based on the assumption that the probability of a system
state is proportional to its static weight, we used the statistical Data from the World Bank and Eurostat Health
weight of the state as a characteristic of its probability. Statistics were used as the initial dataset for constructing
In statistical physics, equilibrium states do not tend rank-size dependencies of resource allocation. The dataset
to change over time. Consequently, the property of state timeline covers the period from 2010 to 2022. The selected
indicators included physicians per 1,000 people, specialist
equilibrium is most inherent in the macrostate of the surgical workforce per 100,000 population, hospital beds
system, which has the highest probability and therefore the
maximum statistical weight. The highest probability of an per 1,000 people, and total population (DataBank. Health
equilibrium state determines the maximum entropy of the Nutrition and Population Statistics 2023, organization for
system that has passed into an equilibrium state. economic co-operation and development [OECD] Health
Statistics 2024). Using these datasets, the total number of
It is well known that when placing K elements on N physicians, specialist surgical workforce, and hospital beds
different objects provided that exactly K elements fall into for each country was calculated. Rank-size dependencies
i
the i object (i = 1, 2, 3...N), the number of placements were then constructed, representing the relationship
th
(statistical weight, G) is determined using Equation V. between a country’s competitive rank and the selected
K! indicators. The ranking assigned the highest position to
G = (V)
KK K! ! !........ K ! the country with the maximum value for a given indicator,
1
N
3
2
with all subsequent ranks arranged in descending order.
Where K! accounts for all permutations of K specialists,
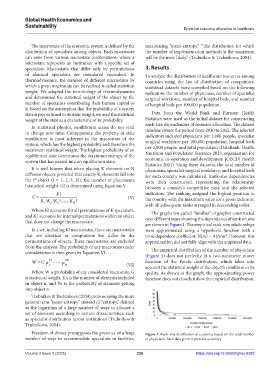
The graphs (so-called “families” of graphs) constructed
and K! accounts for internal permutations within an object over different years showing the dependence of rank on size
i
that does not change the macrostate.
are shown in Figure 1. The empirical rank-size relationships
In a set, including K! macrostates, there are macrostates were approximated using a hyperbolic function with a
that are identical in composition but differ in the time-dependent coefficient: N(m) = A(t)/m . However, this
α
permutations of objects. These macrostates are excluded approximation did not fully align with the empirical data.
from the analysis. The probability of any macrostate under
consideration is then given by Equation VI. The empirical distribution of the number of physicians
(Figure 1) does not perfectly fit a two-parameter power
W G K1 KN function of the Pareto distribution, which takes into
P 1 P N (VI) account the statistical weight of the object’s condition or its
Where W is probability of any considered microstate, G quality. As shown in the graph, the approximating power
is statistical weight, Kn is the number of elements included function does not closely follow the empirical distribution,
in object n, and Pn is the probability of elements getting
into object n.
Trubnikov & Trubnikova (2004) propose using the more
general term “quasi-entropy” instead of “entropy,” defined
as the logarithm of a large number of ways to allocate a
set of elements according to certain characteristics, such
as specialist distribution across institutions (Trubnikov &
Trubnikova, 2004).
Freedom of choice presupposes the presence of a large Figure 1. Rank-size distribution of countries based on the total number
number of ways to accommodate specialists in facilities, of physicians. Each data point represents a country.
Volume 3 Issue 3 (2025) 236 https://doi.org/10.36922/ghes.8283