
Page 246 - GHES-3-3
P. 246
Global Health Economics and
Sustainability
Empirical resource allocation in healthcare
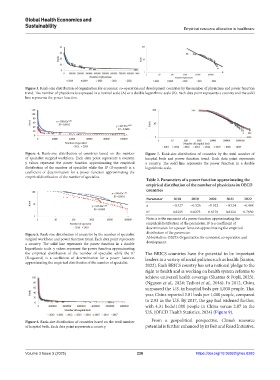
Figure 3. Rank-size distribution of organisation for economic co-operation and development countries by the number of physicians and power function
trend. The number of physicians is expressed in a normal scale (A) or a double logarithmic scale (B). Each data point represents a country and the solid
line represents the power function.
Figure 4. Rank-size distribution of countries based on the number Figure 7. Rank-size distribution of countries by the total number of
of specialist surgical workforce. Each data point represents a country. hospital beds and power function trend. Each data point represents
y values represent the power function approximating the empirical a country. The solid line represents the power function in a double
2
distribution of the number of specialist while the R (R-squared) is a logarithmic scale.
coefficient of determination for a power function approximating the
empirical distribution of the number of specialist.
Table 2. Parameters of a power function approximating the
empirical distribution of the number of physicians in OECD
countries
Parameter 2018 2019 2020 2021 2022
α −0.527 −0.526 −0.522 −0.524 −0.488
R 2 0.8205 0.8273 0.8179 0.8224 0.7930
Note: α is the exponent of a power function approximating the
empirical distribution of the parameter; R is a coefficient of
2
determination for a power function approximating the empirical
Figure 5. Rank-size distribution of countries by the number of specialist distribution of the parameter.
surgical workforce and power function trend. Each data point represents Abbreviation: OECD: Organization for economic co-operation and
a country. The solid line represents the power function in a double development.
logarithmic scale. y values represent the power function approximating
the empirical distribution of the number of specialist while the R 2 The BRICS countries have the potential to be important
(R-squared) is a coefficient of determination for a power function leaders in a variety of social policies such as health (Santos,
approximating the empirical distribution of the number of specialist.
2022). Each BRICS country has set a national pledge to the
right to health and is working on health system reforms to
achieve universal health coverage (Sharma & Popli, 2023).
(Nguyen et al., 2024; Tediosi et al., 2016). In 2012, China
surpassed the U.S. in hospital beds per 1,000 people. That
year, China reported 3.01 beds per 1,000 people, compared
to 2.93 in the U.S. By 2017, the gap had widened further,
with 4.31 beds/1,000 people in China versus 2.87 in the
U.S. (OECD Health Statistics, 2024) (Figure 9).
Figure 6. Rank-size distribution of countries based on the total number From a geopolitical perspective, China’s resource
of hospital beds. Each data point represents a country. potential is further enhanced by its Belt and Road Initiative,
Volume 3 Issue 3 (2025) 238 https://doi.org/10.36922/ghes.8283