
Page 247 - GHES-3-3
P. 247
Global Health Economics and
Sustainability
Empirical resource allocation in healthcare
Table 3. Parameters of a power function approximating the empirical distribution of the number of hospital beds
Parameter 2010 2011 2012 2013 2014 2015 2016 2017
α −0.481 −0.484 −0.487 −0.489 −0.472 −0.455 −0.455 −0.455
R 2 0.887 0.888 0.901 0.901 0.905 0.933 0.932 0.922
Note: α is the exponent of a power function approximating the empirical distribution of the parameter; R is a coefficient of determination for a power
2
function approximating the empirical distribution of the parameter.
Table 4. Parameters of a power function approximating the empirical distribution of the number of hospital beds per 100,000
population for the combined group of countries
Parameter 2006 2007 2008 2009 2010 2011 2012 2013 2014
α −2.18 −2.17 −2.15 −2.13 −2.11 −2.09 −2.04 −2.00 −1.88
R 2 0.861 0.845 0.856 0.883 0.920 0.929 0.916 0.928 0.924
Note: α is the exponent of a power function approximating the empirical distribution of the parameter; R is a coefficient of determination for a power
2
function approximating the empirical distribution of the parameter.
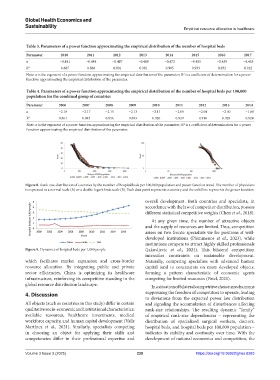
Figure 8. Rank-size distribution of countries by the number of hospital beds per 100,000 population and power function trend. The number of physicians
is expressed in a normal scale (A) or a double logarithmic scale (B). Each data point represents a country and the solid line represents the power function.
overall development. Both countries and specialists, in
accordance with the law of competitor distribution, possess
different statistical competitive weights (Chen et al., 2018).
At any given time, the number of attractive objects
and the supply of resources are limited. Thus, competition
arises on two fronts: specialists vie for positions at well-
developed institutions (Plemmenos et al., 2023), while
institutions compete to attract highly skilled professionals
Figure 9. Dynamics of hospital beds per 1,000 people (Jakovljevic et al., 2024). This bilateral competition
intensifies constraints on sustainable development.
which facilitates market expansion and cross-border Naturally, competing specialists with advanced human
resource allocation. By integrating public and private capital tend to concentrate on more developed objects,
sector efficiencies, China is optimizing its healthcare forming a pattern characteristic of economic agents
infrastructure, reinforcing its competitive standing in the competing for limited resources (Patel, 2021).
global resource distribution landscape. In a situation of bilateral competitive choice, mechanisms
4. Discussion suppressing the freedom of competitors to operate, leading
to deviations from the expected power law distribution
All objects (such as countries in this study) differ in certain and signaling the accumulation of disturbances affecting
qualitative socio-economic and institutional characteristics: rank-size relationships. The resulting dynamic “family”
available resources, healthcare investments, medical of empirical rank-size dependencies – representing the
workforce capacity, and human capital development (Valls distribution of specialized surgical workers, doctors,
Martínez et al., 2021). Similarly, specialists competing hospital beds, and hospital beds per 100,000 population –
in choosing an object for applying their skills and indicates its stability and continuity over time. With the
competencies differ in their professional expertise and development of national economies and competition, the
Volume 3 Issue 3 (2025) 239 https://doi.org/10.36922/ghes.8283