
Page 245 - GHES-3-3
P. 245
Global Health Economics and
Sustainability
Empirical resource allocation in healthcare
particularly at the lower and higher rank extremes, despite Similarly, rank-size dependencies were constructed on
a coefficient of determination close to 0.8. This lack of the number of specialist surgical workforce (Figure 4) and
approximation may arise due to: sampling biases and the the hospital beds (Figure 5). The deviations from a linear
lack of representativeness at both low and high ranks; and rank-size dependence observed for these resources further
the limited applicability of the lognormal distribution in confirm the disparity in their distribution. The obtained
capturing extreme values. specifications for both specialist surgical workforce and
To further test whether the empirical data follows hospital beds indicate even greater inequality across
Pareto’s law, the graph was translated into a double countries than predicted by the Pareto distribution.
logarithmic scale. The expected outcome, according to To confirm the hypothesis of the stability of the
Pareto’s law, is a linear trend on this scale. However, as empirical distribution over time and its partial deviation
shown in Figure 2, deviations occur at both extremes of the from the Pareto distribution, rank-size dependencies were
rank spectrum, with the empirical curve bending upwards tested over eight years. In each analyzed year, the empirical
rather than maintaining a straight line. distribution of hospital beds consistently differed from the
The form of the resulting rank-size dependence, which Pareto power function (Figures 6 and 7).
deviates from a linear form, indicates a stronger inequality Table 3 presents the values of the α parameter of the
in the distribution of physicians across countries compared hyperbolic function, which measures inequality in the
to the Pareto distribution. distribution of hospital beds. As α increases, the downward
Table 1 shows the values of the parameter α of the curvature of the hyperbola decreases, meaning a larger
hyperbolic function, which serves as a measure of downward bulge corresponds to a reduced gap between
inequality in the distribution of physicians. A higher α resource reserves across countries (Reedy et al., 2024). The
value corresponds to a steeper downward curvature of the observed values indicate a slight increase in inequality in
hyperbola, signifying stronger inequality. The observed resource allocation between 2010 and 2015, followed by
values suggest a slight trend toward decreasing inequality a stabilization of inequality levels. Among the examined
in physician allocation over time. resources, the distribution of hospital beds aligns most
closely with the Pareto distribution when compared to the
This conclusion is supported by empirical analysis
of Eurostat data (Figure 3). However, based on the α distribution of physicians and specialist surgical workforce.
coefficient, the distribution of physicians within OECD An analysis of hospital beds per 100,000 population
countries from 2018 to 2022 exhibits significant unevenness dataset across a combined group of OECD countries, the
(Table 2). Commonwealth of Independent States, South-Eastern
Europe, and smaller countries reinforces the hypothesis
of persistent disparities in resource allocation (Figure 8).
However, a higher α value indicates a lesser degree of
unevenness in the distribution of hospital beds per 100,000
population within this broader country group (Table 4).
The rank-size dependencies for physicians, specialist
surgical workforce, hospital beds, and hospital beds per 100,000
population indicate stability in their distribution patterns over
time. While individual country rankings fluctuate year by
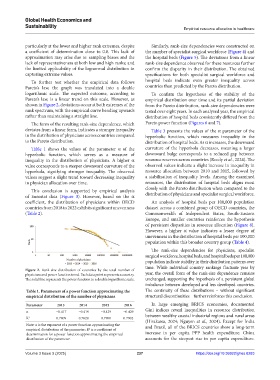
Figure 2. Rank-size distribution of countries by the total number of
physicians and power function trend. Each data point represents a country. year, the overall form of the rank-size dependence remains
The solid line represents the power function in a double logarithmic scale. unchanged, supporting the hypothesis of a persistent global
imbalance between developed and less developed countries.
Table 1. Parameters of a power function approximating the The continuity of these distributions – without significant
empirical distribution of the number of physicians structural discontinuities – further reinforces this conclusion.
Parameter 2013 2014 2015 2016 In large emerging BRICS economies, documented
α −0.417 −0.419 −0.429 −0.429 Gini indices reveal inequalities in resource distribution
R 2 0.7809 0.7828 0.7900 0.7902 between wealthy coastal industrial regions and rural areas
(Hirakawa, 2024; Nguyen et al., 2024). Except for India
Note: α is the exponent of a power function approximating the and Brazil, all of the BRICS countries show a long-term
empirical distribution of the parameter; R is a coefficient of
2
determination for a power function approximating the empirical increase in per capita PPP health expenditure. China
distribution of the parameter. accounts for the steepest rise in per capita expenditure.
Volume 3 Issue 3 (2025) 237 https://doi.org/10.36922/ghes.8283