
Page 286 - GHES-3-3
P. 286
Global Health Economics and
Sustainability
Carbon footprint of smartphones in healthcare
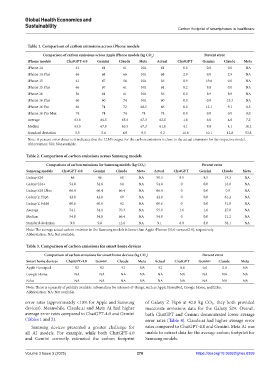
Table 1. Comparison of carbon emissions across iPhone models
Comparison of carbon emissions across Apple iPhone models (kg CO ) Percent error
2
iPhone models ChatGPT‑4.0 Gemini Claude Meta Actual ChatGPT Gemini Claude Meta
iPhone 14 61 61 61 NA 61 0.0 0.0 0.0 NA
iPhone 14 Plus 66 68 66 NA 68 2.9 0.0 2.9 NA
iPhone 15 61 67 56 NA 56 8.9 19.6 0.0 NA
iPhone 15 Plus 66 67 61 NA 61 8.2 9.8 0.0 NA
iPhone 16 56 61 61 NA 56 0.0 8.9 8.9 NA
iPhone 16 Plus 60 60 74 NA 60 0.0 0.0 23.3 NA
iPhone 16 Pro 66 74 72 60.5 66 0.0 12.1 9.1 8.3
iPhone 16 Pro Max 74 74 74 74 74 0.0 0.0 0.0 0.0
Average 63.8 66.5 65.6 67.3 62.8 1.6 6.0 4.6 7.2
Median 63.5 67.0 63.5 67.3 61.0 4.1 9.8 4.1 10.2
Standard deviation 5.5 5.6 6.9 9.5 6.2 11.8 10.1 12.0 53.8
Note: A percent error closer to 0 indicates that the LLM’s output for the carbon emissions is close to the actual emissions for the respective model.
Abbreviation: NA: Not available.
Table 2. Comparison of carbon emissions across Samsung models
Comparison of carbon emissions for Samsung models (kg CO₂) Percent error
Samsung models ChatGPT‑4.0 Gemini Claude Meta Actual ChatGPT Gemini Claude Meta
Galaxy S24 46 46 60 NA 50.3 8.5 8.5 19.3 NA
Galaxy S24+ 54.8 54.8 64 NA 54.8 0 0.0 16.8 NA
Galaxy S24 Ultra 66.4 66.4 66.4 NA 66.4 0 0.0 0.0 NA
Galaxy Z Flip6 42.8 42.8 69 NA 42.8 0 0.0 61.2 NA
Galaxy Z Fold6 60.6 60.6 92 NA 60.6 0 0.0 51.8 NA
Average 54.1 54.1 70.3 NA 55.0 1.6 1.6 27.8 NA
Median 54.8 54.8 66.4 NA 54.8 0 0.0 21.2 NA
Standard deviation 9.8 9.8 12.6 NA 9.1 8.0 8.0 38.1 NA
Note: The average actual carbon emission in the Samsung models is lower than Apple iPhones (55.0 versus 62.8), respectively.
Abbreviation: NA: Not available.
Table 3. Comparison of carbon emissions for smart home devices
Comparison of carbon emissions for smart home devices (kg CO ) Percent error
2
Smart home devices ChatGPT‑4.0 Gemini Claude Meta Actual ChatGPT Gemini Claude Meta
Apple Homepod 92 92 92 NA 92 0.0 0.0 0.0 NA
Google Home NA NA NA NA NA NA NA NA NA
Echo NA NA NA NA NA NA NA NA NA
Note: There is a paucity of publicly available information for internet-of-things, such as Apple HomePod, Google Home, and Echo.
Abbreviation: NA: Not available.
error rates (approximately <10% for Apple and Samsung of Galaxy Z Flip6 at 42.8 kg CO₂, they both provided
devices). Meanwhile, Claude.ai and Meta AI had higher inaccurate emissions data for the Galaxy S24. Overall,
average error rates compared to ChatGPT-4.0 and Gemini both ChatGPT and Gemini demonstrated lower average
(Tables 1 and 2). error rates (Table 4). Claude.ai had higher average error
Samsung devices presented a greater challenge for rates compared to ChatGPT-4.0 and Gemini. Meta AI was
all AI models. For example, while both ChatGPT-4.0 unable to extract data for the average carbon footprint for
and Gemini correctly estimated the carbon footprint Samsung models.
Volume 3 Issue 3 (2025) 278 https://doi.org/10.36922/ghes.8359