
Page 87 - GPD-2-2
P. 87
Gene & Protein in Disease Verteporfin therapy for triple-negative breast cancer
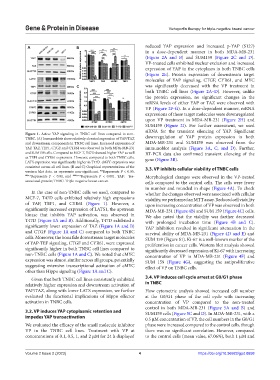
A B reduced YAP expression and increased p-YAP (S127)
in a dose-dependent manner in both MDA-MB-231
(Figure 2A and B) and SUM159 (Figure 2C and D).
VP-treated cells exhibited nuclear exclusion and increased
expression of YAP in the cytoplasm in both TNBC cells
(Figure 2E). Protein expression of downstream target
molecules of YAP signaling, CTGF, CYR61, and MYC
C was significantly decreased with the VP treatment in
both TNBC cell lines (Figure 2A–D). However, unlike
the protein expression, no significant changes in the
mRNA levels of either YAP or TAZ were observed with
VP (Figure 2F-G). In a dose-dependent manner, mRNA
expressions of these target molecules were downregulated
upon VP treatment in MDA-MB-231 (Figure 2H) and
SUM159 (Figure 2I). For further assessment, we used
siRNA for the transient silencing of YAP. Significant
Figure 1. Active YAP signaling in TNBC cell lines compared to non-
TNBC. (A) Immunoblots show relatively elevated expression of YAP/TAZ downregulation of YAP protein expression in both
and downstream components in TNBC cell lines. Increased expression of MDA-MB-231 and SUM159 was observed from the
YAP, TAZ, TEF1, CTGF, and CYR61 was observed in both MDA-MB-231 immunoblot analysis (Figure 3A, C, and D). Further,
and SUM159 cells. Compared to MCF-7, T47D showed higher YAP as well RT-PCR data also confirmed transient silencing of the
as TEF1 and CYR61 expression. However, compared to both TNBC cells, gene (Figure 3B).
LATS expression was significantly higher in T47D. cMYC expression was
consistent across all cell lines. (B and C) Graphical representations of the 3.3. VP inhibits cellular viability of TNBC cells
western blot data. ns represents non-significant, *Represents P < 0.05,
#/
##/ **Represents P < 0.01, and ###/ ***Represents P < 0.001. YAP: Yes- Morphological changes were observed in the VP-treated
associated protein; TNBC: Triple-negative breast cancer. cells compared to the control cells. The cells were fewer
in number and rounded in shape (Figure 4A). To check
In the case of non-TNBC cells we used, compared to whether the changes observed were associated with cellular
MCF-7, T47D cells exhibited relatively high expressions viability, we performed an MTT assay. Reduced cell viability
of YAP, TEF1, and CYR61 (Figure 1). However, a upon increasing concentration of VP was observed in both
significantly increased expression of LATS1, the upstream MDA-MB-231 (Figure 4B) and SUM 159 (Figure 4C) cells.
kinase that inhibits YAP activation, was observed in We also noted that the viability was further decreased
T47D (Figure 1A and B). Additionally, T47D exhibited a with prolonged incubation time (Figure 4B and C).
significantly lower expression of TAZ (Figure 1A and B) YAP inhibition resulted in significant attenuation in the
and CTGF (Figure 1A and C) compared to both TNBC survival ability of MDA-MB-231 (Figure 4D and E) and
cells. Moreover, the bona fide downstream target molecules SUM 159 (Figure S1). Ki-67 is a well-known marker of the
of YAP-TEF signaling, CTGF and CYR61, were expressed proliferation in cancer cells. Western blot analysis showed
significantly higher in both TNBC cell lines compared to significantly decreased expression of Ki-67 with increasing
non-TNBC cells (Figure 1A and C). We noted that cMYC concentration of VP in MDA-MB-231 (Figure 4F) and
expression was almost similar across all groups, potentially SUM 159 (Figure 4G), suggesting the antiproliferative
suggesting extensive transcriptional activation of cMYC effect of VP on TNBC cells.
other than Hippo signaling (Figure 1A and C).
Given that both TNBC cell lines consistently exhibited 3.4. VP induces cell cycle arrest at G0/G1 phase
relatively higher expression and downstream activation of in TNBC
YAP/TAZ, along with lower LATS expression, we further Flow cytometric analysis showed increased cell number
evaluated the functional implications of Hippo effector at the G0/G1 phase of the cell cycle with increasing
activation in TNBC cells. concentration of VP compared to the non-treated
control in both MDA-MB-231 (Figure 5A and B) and
3.2. VP induces YAP cytoplasmic retention and SUM159 cells (Figure 5C and D). In MDA-MB-231, with a
impedes YAP transactivation 0.5 µM concentration of VP, the cell numbers in the G0/G1
We evaluated the efficacy of the small molecule inhibitor phase were increased compared to the control cells, though
VP in the TNBC cell lines. Treatment with VP at there was no significant correlation. However, compared
concentrations of 0.1, 0.5, 1, and 2 µM for 24 h displayed to the control cells (mean value, 67.06%), both 1 µM and
Volume 2 Issue 2 (2023) 4 https://doi.org/10.36922/gpd.0658