
Page 68 - GPD-2-3
P. 68
Gene & Protein in Disease Testosterone as a biomarker of colorectal cancer
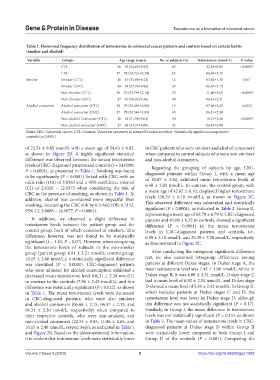
Table 1. Hormonal frequency distribution of testosterone in colorectal cancer patients and controls based on certain habits
(smoker and alcohol)
Variable Groups Age range (years) No. of subjects (n) Testosterone (nmol/L) P‑value
CTL 36 – 76 (54.63±9.83) 65 22.54±8.85 <0.0001*
CRC 37 – 78 (54.72±10.24) 65 06.68±2.15
Smoker Smoker (CTL) 40 – 67 (55.08±9.22) 12 07.82±1.78 0.07
Smoker (CRC) 38 – 78 (57.70±9.93) 37 06.57±2.13
Non-Smoker (CTL) 36 – 76 (53.79±12.14) 53 11.86±2.65 <0.0001*
Non-Smoker (CRC) 37 – 67 (50.92±9.36) 28 06.81±2.21
Alcohol consumer Alcohol consumer (CTL) 38 – 70 (55.40±10.88) 15 07.96±2.45 <0.022
Alcohol consumer (CRC) 37 – 78 (55.54±11.05) 43 06.31±2.30
Non-alcohol Consumer (CTL) 36 – 76 (51.58±9.64) 50 10.15±2.48 <0.0001*
Non-alcohol consumer (CRC) 37 – 68 (53.95±8.00) 22 06.87±2.00
Notes: CRC: Colorectal cancer; CTL: Controls. Values are presented as mean±SD unless specified. *Statistically significant compared to
controls (p<0.0001).
of 22.54 ± 8.85 nmol/L with a mean age of 54.63 ± 9.83, in CRC patients who were smokers and alcohol consumers
as shown in Figure 2B. A highly significant statistical when compared to control subjects who were non-smokers
difference was observed between the serum testosterone and non-alcohol consumers.
levels of CRC-diagnosed patients and controls (t = 14.0399, Regarding the grouping of subjects by age, CRC-
P < 0.0001), as presented in Table 1. Smoking was found diagnosed patients within Group I, with a mean age
to be significantly (P < 0.0001) linked with CRC, with an
odds ratio (OR) of 5.8363 and a 95% confidence interval of 43.87 ± 3.62, exhibited mean testosterone levels of
6.40 ± 2.03 nmol/L. In contrast, the control group, with
(CI) of 2.6329 – 12.9373 when considering the risk of a mean age of 42.62 ± 6.10, displayed higher testosterone
CRC in the presence of smoking, as shown in Table 1. In
addition, alcohol was considered more impactful than levels (28.29 ± 6.10 nmol/L), as shown in Figure 2C.
smoking, increasing the CRC risk by 6.5-fold (OR: 6.5152, This observed difference was substantial and statistically
95% CI: 3.0088 – 14.1077, P < 0.0001). significant (P < 0.0001), as indicated in Table 2. Group II,
representing a mean age of 62.79 ± 6.79 in CRC-diagnosed
In addition, we observed a slight difference in patients and 61.08 ± 6.32 in controls, showed a significant
testosterone levels between the patient group and the difference (P < 0.0001) in the mean testosterone
control group, both of which consisted of smokers. This levels in CRC-diagnosed patients and controls, i.e.,
difference, however, was not found to be statistically 6.58 ± 2.18 nmol/L and 20.39 ± 7.20 nmol/L, respectively,
significant (t = 1.82, P = 0.07). However, when comparing as demonstrated in Figure 2C.
the testosterone levels of subjects in the non-smoker
group (patient group: 6.81 ± 2.21 nmol/L; control group: After conducting the intergroup significant difference
10.15 ± 2.48 nmol/L), a statistically significant difference test, we also examined intragroup differences among
was identified (P < 0.0001). CRC-diagnosed patients patients at different Dukes stages. In Dukes stage A, the
who were adjusted for alcohol consumption exhibited a mean testosterone level was 7.43 ± 1.86 nmol/L, while in
decreased mean testosterone level (06.31 ± 2.30 nmol/L) Dukes stage B, it was 6.00 ± 2.31 nmol/L. Dukes stage C
in contrast to the controls (7.96 ± 2.45 nmol/L), and this had a mean level of 6.92 ± 2.54 nmol/L, and Dukes stage
difference was statistically significant (P < 0.022), as shown D showed a mean level of 5.85 ± 2.42 nmol/L. In Group II,
in Table 1. The mean testosterone levels were decreased which includes patients at Dukes stages C and D, the
in CRC-diagnosed patients, who were also smokers testosterone level was lower in Dukes stage D, although
and alcohol consumers (06.68 ± 2.15, 06.57 ± 2.13, and this difference was not statistically significant (P = 0.17).
06.31 ± 2.30 nmol/L, respectively) when compared to Similarly, in Group I, the mean difference in testosterone
their respective controls, who were non-smokers, and levels was not statistically significant (P = 0.15), as shown
non-alcohol consumers (22.54 ± 8.85, 11.86 ± 2.65, and in Table 2. The mean values of testosterone levels in CRC-
10.15 ± 2.48 nmol/L, respectively), as indicated in Table 1 diagnosed patients at Dukes stage D within Group II
and Figure 2B. Based on the aforementioned information, were statistically lower compared to both Group I and
it is evident that testosterone levels were statistically lower Group II of the controls (P < 0.001). Comparing the
Volume 2 Issue 3 (2023) 5 https://doi.org/10.36922/gpd.1082