
Page 68 - GPD-2-4
P. 68
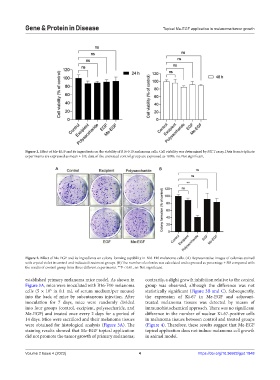
Gene & Protein in Disease                                 Topical Me-EGF application in melanoma tumor growth


            Figure 1. Effect of Me-EGF and its ingredients on the viability of B16-F10 melanoma cells. Cell viability was determined by MTT assay. Data from triplicate
            experiments are expressed as mean ± SD; data of the untreated control group are expressed as 100%. ns: Not significant.

                         A                                           B


            Figure 2. Effect of Me-EGF and its ingredients on colony-forming capability in B16-F10 melanoma cells. (A) Representative images of colonies stained
            with crystal violet in control and indicated treatment groups. (B) The number of colonies was calculated and expressed as percentage ± SD compared with
            the results of control group from three different experiments. **P < 0.01, ns: Not significant.


            established primary melanoma mice model. As shown in   contrarily, a slight growth inhibition relative to the control
            Figure 3A, mice were inoculated with B16-F10 melanoma   group was observed, although the difference was not
            cells (5  × 10  in 0.1  mL of serum medium/per mouse)   statistically significant (Figure 3B and C). Subsequently,
                      5
            into the back of mice by subcutaneous injection. After   the expression of Ki-67 in Me-EGF and adjuvant-
            inoculation for 7  days, mice were randomly divided   treated melanoma tissues was detected by means of
            into four groups (control, excipient, polysaccharide, and   immunohistochemical approach. There was no significant
            Me-EGF) and treated once every 2 days for a period of   difference in the number of nuclear Ki-67-positive cells
            14 days. Mice were sacrificed and their melanoma tissues   in melanoma tissues between control and treated groups
            were obtained for histological analysis (Figure 3A). The   (Figure 4). Therefore, these results suggest that Me-EGF
            staining results showed that Me-EGF topical application   topical application does not induce melanoma cell growth
            did not promote the tumor growth of primary melanoma;   in animal model.


            Volume 2 Issue 4 (2023)                         4                        https://doi.org/10.36922/gpd.1848