
Page 69 - GPD-2-4
P. 69
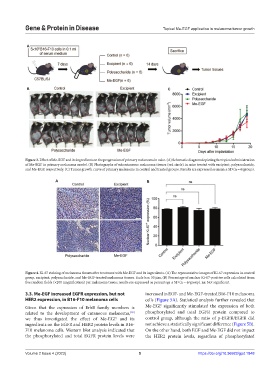
Gene & Protein in Disease                                 Topical Me-EGF application in melanoma tumor growth


            A


            B                                                           C


            Figure 3. Effect of Me-EGF and its ingredients on the progression of primary melanoma in mice. (A) Schematic diagram depicting the topical administration
            of Me-EGF in primary melanoma model. (B) Photographs of subcutaneous melanoma tissues (red circle) in mice treated with excipient, polysaccharide,
            and Me-EGF, respectively. (C) Tumor growth curve of primary melanoma in control and treated groups. Results are expressed as mean ± SD (n = 6/group).

                         A                                     B


            Figure 4. Ki-67 staining of melanoma tissues after treatment with Me-EGF and its ingredients. (A) The representative images of Ki-67 expression in control
            group, excipient, polysaccharide, and Me-EGF-treated melanoma tissues. Scale bar: 50 µm. (B) Percentage of nuclear Ki-67-positive cells calculated from
            five random fields (×200 magnification) per melanoma tissue; results are expressed as percentage ± SD (n = 6/group). ns: Not significant.

            3.3. Me-EGF increased EGFR expression, but not     increased in EGF- and Me-EGF-treated B16-F10 melanoma
            HER2 expression, in B16-F10 melanoma cells         cells (Figure 5A). Statistical analysis further revealed that
            Given that the expression of ErbB family members is   Me-EGF significantly stimulated the expression of both
            related to the development of cutaneous melanoma,    phosphorylated and total EGFR protein compared to
                                                        [19]
            we thus investigated the effect of Me-EGF and its   control group, although the ratio of p-EGFR/EGFR did
            ingredients on the EGFR and HER2 protein levels in B16-  not achieve a statistically significant difference (Figure 5B).
            F10 melanoma cells. Western blot analysis indicated that   On the other hand, both EGF and Me-EGF did not impact
            the phosphorylated and total EGFR  protein levels were   the HER2 protein levels, regardless of phosphorylated


            Volume 2 Issue 4 (2023)                         5                        https://doi.org/10.36922/gpd.1848