
Page 67 - GPD-3-1
P. 67
Gene & Protein in Disease In silico application of the CoM method
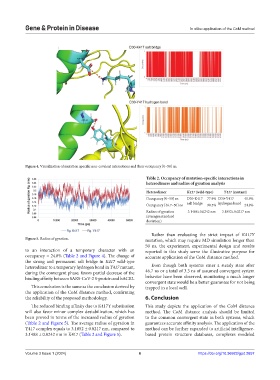
Figure 4. Visualization of mutation specific non-covalent interactions and their occupancy [0–50] ns.
Table 2. Occupancy of mutation‑specific interactions in
heterodimers and radius of gyration analysis
Heterodimer K417 (wild‑type) Y417 (mutant)
Occupancy [0–50] ns D30-K417 77.9% D30-Y417 41.9%
Occupancy [46.7–50] ns salt bridge 98.5% hydrogen bond 24.8%
Radius of gyration 3.1488±0.0242 nm 3.1852±0.0217 nm
(average±standard
deviation)
Rather than evaluating the strict impact of K417Y
Figure 5. Radius of gyration. mutation, which may require MD simulation longer than
50 ns, the experiment, experimental design and results
to an interaction of a temporary character with an reported in this study serve the illustrative purpose for
occupancy = 24.8% (Table 2 and Figure 4). The change of accurate application of the CoM distance method.
the strong and permanent salt bridge in K417 wild-type
heterodimer to a temporary hydrogen bond in Y417 mutant, Even though both systems enter a steady state after
during the convergent phase, favors partial decrease of the 46.7 ns or a total of 3.3 ns of assumed convergent system
binding affinity between SARS-CoV-2 S-protein and hACE2. behavior have been observed, monitoring a much longer
convergent state would be a better guarantee for not being
This conclusion is the same as the conclusion derived by trapped in a local well.
the application of the CoM distance method, confirming
the reliability of the proposed methodology. 6. Conclusion
The reduced binding affinity due to K417Y substitution This study depicts the application of the CoM distance
will also favor minor complex destabilization, which has method. The CoM distance analysis should be limited
been proved in terms of the increased radius of gyration to the common convergent state in both systems, which
(Table 2 and Figure 5). The average radius of gyration in guarantees accurate affinity analysis. The application of the
Y417 complex equals to 3.1852 ± 0.0217 nm, compared to method can be further expanded to artificial intelligence-
3.1488 ± 0.0242 nm in K417 (Table 2 and Figure 5). based protein structure databases, complexes modeled
Volume 3 Issue 1 (2024) 6 https://doi.org/10.36922/gpd.2657