
Page 122 - GPD-3-3
P. 122
Gene & Protein in Disease Hydrogen sulfide ameliorates NAFLD
2.8. Hydrogen sulfide content assay Biotechnology Co., LTD, China). Non-specific binding
Hydrogen sulfide concentration was determined using was blocked by incubating the membrane with a
the methylene blue spectrophotometric method. NaHS solution of 5% milk or BSA in Tris buffer for 4 h. The
was weighed, and different concentrations of H S were membrane was then washed and cut into strips based
2
prepared by diluting with NaOH solution. The solution on the molecular weight of the target proteins. Primary
was transferred to Eppendorf tubes and mixed gently. antibodies were incubated overnight at 4°C, followed
A color developer mixture was added to each tube, along by washing with TBST (Beijing Lanjieke Technology
with diammonium hydrogen phosphate solution, to Co., LTD, China). The membrane was then incubated
eliminate interference. The tubes were then centrifuged, with secondary antibodies for 2 h. Finally, enhanced
and the supernatant was pipetted into a cell culture plate chemiluminescence imaging was used to visualize the
for absorbance measurement. A standard curve was plotted protein bands.
using the obtained data to calculate the H S concentration 2.10. Transcriptome data
2
in the samples. 45
Human NAFLD liver transcriptional data were acquired
2.9. Western blot from the GEO database. Bioinformatics tools were used
46
Liver samples were diced, and proteins were extracted for analysis, including principal component analysis,
using RIPA lysis buffer (Beijing Lanjieke Technology differential expression analysis, Kyoto Encyclopedia of
Co., LTD, China) containing inhibitors. Protein Genes and Genomes pathway enrichment, and Gene
concentration was measured using a BCA kit (Beijing Ontology functional enrichment analysis.
Labgic Technology Co., LTD, China). Sodium dodecyl
sulfate-polyacrylamide gel electrophoresis (Wuhan 2.11. Statistical analysis
Xavier Biotechnology Co., LTD, China) was performed Data from the experiments were analyzed using various
to separate the proteins, which were then transferred to a medical statistical analysis software such as Statistical
polyvinylidene fluoride membrane (Nanjing Nuoweizan Package for the Social Sciences 26, ImageJ 23, and
A B
C
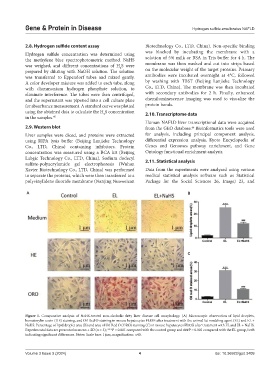
Figure 1. Comparative analysis of NaHS-treated non-alcoholic fatty liver disease cell morphology. (A) Microscopic observation of lipid droplets,
hematoxylin-eosin (HE) staining, and Oil Red O staining in mouse hepatocytes FL83B after treatment with the animal fat modeling agent (EL) and EL +
NaHS. Percentage of lipid droplet area (B) and area of Oil Red O (ORO) staining (C) in mouse hepatocytes FL83B after treatment with EL and EL + NaHS.
Experimental data are presented as mean ± SD (n = 3); ***P < 0.001 compared with the control group and ###P < 0.001 compared with the EL group, both
indicating significant differences. Notes: Scale bars: 1 μm, magnification: ×40.
Volume 3 Issue 3 (2024) 4 doi: 10.36922/gpd.3409