
Page 125 - GPD-3-3
P. 125
Gene & Protein in Disease Hydrogen sulfide ameliorates NAFLD
A B
C
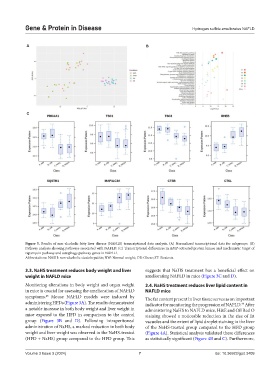
Figure 5. Results of non-alcoholic fatty liver disease (NAFLD) transcriptional data analysis. (A) Normalized transcriptional data for subgroups. (B)
Pathway analysis showing pathways associated with NAFLD. (C) Transcriptional differences in AMP-activated protein kinase and mechanistic target of
rapamycin pathway and autophagy pathway genes in NAFLD.
Abbreviations: NASH: non-alcoholic steatohepatitis; NW: Normal weight; OB: Obese; ST: Steatosis.
3.3. NaHS treatment reduces body weight and liver suggests that NaHS treatment has a beneficial effect on
weight in NAFLD mice ameliorating NAFLD in mice (Figure 3C and D).
Monitoring alterations in body weight and organ weight 3.4. NaHS treatment reduces liver lipid content in
in mice is crucial for assessing the amelioration of NAFLD NAFLD mice
symptoms. Mouse NAFLD models were induced by The fat content present in liver tissue serves as an important
48
administering HFDs (Figure 3A). The results demonstrated indicator for monitoring the progression of NAFLD. After
49
a notable increase in both body weight and liver weight in administering NaHS to NAFLD mice, H&E and Oil Red O
mice exposed to the HFD in comparison to the control staining showed a noticeable reduction in the size of fat
group (Figure 3B and D). Following intraperitoneal vacuoles and the extent of lipid droplet staining in the liver
administration of NaHS, a marked reduction in both body of the NaHS-treated group compared to the HFD group
weight and liver weight was observed in the NaHS-treated (Figure 4A). Statistical analysis validated these differences
(HFD + NaHS) group compared to the HFD group. This as statistically significant (Figure 4B and C). Furthermore,
Volume 3 Issue 3 (2024) 7 doi: 10.36922/gpd.3409