
Page 124 - GPD-3-3
P. 124
Gene & Protein in Disease Hydrogen sulfide ameliorates NAFLD
A
B C
D E
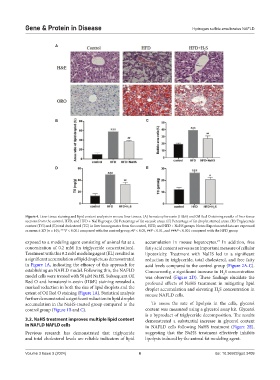
Figure 4. Liver tissue staining and lipid content analysis in mouse liver tissues. (A) hematoxylin-eosin (H&E) and Oil Red O staining results of liver tissue
sections from the control, HFD, and HFD + NaHS groups. (B) Percentage of fat vacuole areas. (C) Percentage of fat droplet stained areas. (D) Triglyceride
content (TG) and (E) total cholesterol (TC) in liver homogenates from the control, HFD, and HFD + NaHS groups. Notes: Experimental data are expressed
as mean ± SD (n = 10); ***P < 0.001 compared with the control group; #P < 0.05, ##P < 0.01, and ###P < 0.001 compared with the HFD group.
exposed to a modeling agent consisting of animal fat at a accumulation in mouse hepatocytes. In addition, free
47
concentration of 0.2 mM (in triglyceride concentration). fatty acid content serves as an important measure of cellular
Treatment with this 0.2 mM modeling agent (EL) resulted in lipotoxicity. Treatment with NaHS led to a significant
a significant accumulation of lipid droplets, as demonstrated reduction in triglyceride, total cholesterol, and free fatty
in Figure 1A, indicating the efficacy of this approach for acid levels compared to the control group (Figure 2A-C).
establishing an NAFLD model. Following this, the NAFLD Concurrently, a significant increase in H S concentration
2
model cells were treated with 50 μM NaHS. Subsequent Oil was observed (Figure 2D). These findings elucidate the
Red O and hematoxylin-eosin (H&E) staining revealed a profound effects of NaHS treatment in mitigating lipid
marked reduction in both the size of lipid droplets and the droplet accumulation and elevating H S concentration in
extent of Oil Red O staining (Figure 1A). Statistical analysis mouse NAFLD cells. 2
further demonstrated a significant reduction in lipid droplet
accumulation in the NaHS-treated group compared to the To assess the rate of lipolysis in the cells, glycerol
control group (Figure 1B and C). content was measured using a glycerol assay kit. Glycerol
is a byproduct of triglyceride decomposition. The results
3.2. NaHS treatment improves multiple lipid content demonstrated a substantial increase in glycerol content
in NAFLD NAFLD cells in NAFLD cells following NaHS treatment (Figure 2E),
Previous research has demonstrated that triglyceride suggesting that the NaHS treatment effectively inhibits
and total cholesterol levels are reliable indicators of lipid lipolysis induced by the animal fat modeling agent.
Volume 3 Issue 3 (2024) 6 doi: 10.36922/gpd.3409